
| Data and Documentation | Chronology and News | Program Status | Publications | Related Data and Resources | Contact Points |
ICOADS Web information page (Wednesday, 20-Jul-2016 18:16:38 UTC):
Release 3 Data Characteristics
1. Quality Control ("trimming") assessmentFor all new historical and contemporary R3.0 input sources, collectively covering the period 1699-2014, Figure 1-1 (note: interactive plot) shows how each deck (DCK) and source ID (SID) responded to the "trimming" quality control processing that is regularly applied to ICOADS (based on three climatological periods, ref. icoads.noaa.gov/dsul.html). The most concerning feature illustrated by these plots is trimming limits missing in remote areas observed by some of the early historical expeditions digitized by ACRE, and in modern GTS buoy data. During translation, we note that only some of the input sources were subject to removal of landlocked reports.
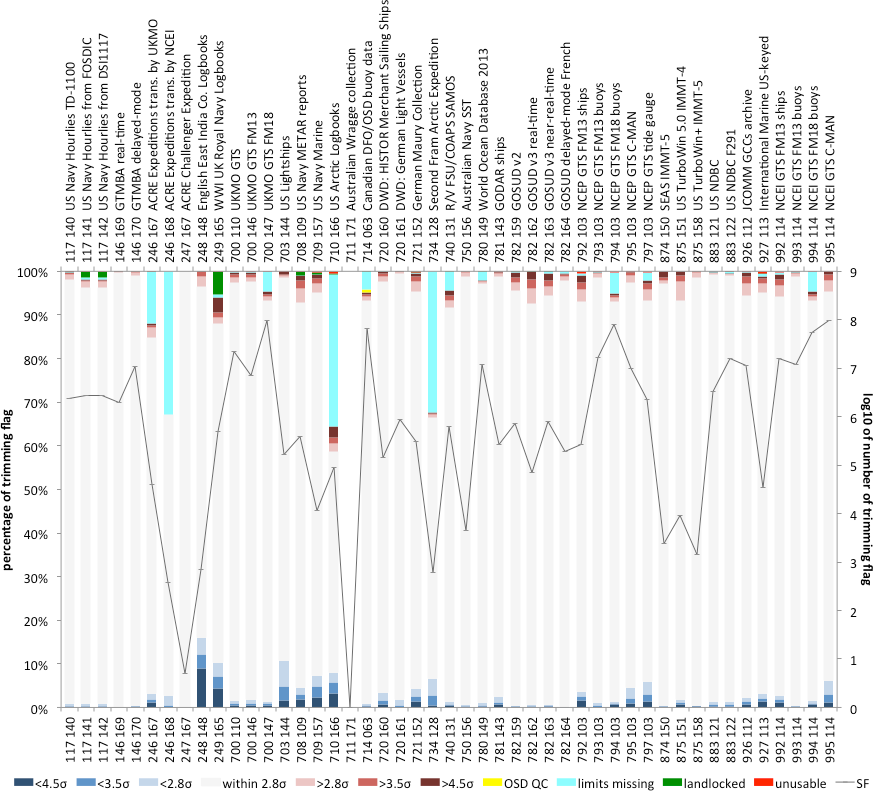
Figure 1-1. Beta4 percentage of trimming flag values per deck and source ID new in Release 3 (bars; left axis) for sea surface temperature (SF), air temperature (AF), u-wind (UF), v-wind (VF), sea level pressure (PF), and relative humidity (RF). Similarly the log10 of the number of non-missing values of the trimming flag (line; right axis). <4.5σ, >4.5σ, limits missing, landlocked, and unusable are trimmed (excluded) from monthly summaries. For comparison, Figures 7a-f at icoads.noaa.gov/r2.5.html present similar information for the R2.5 output data. (Note: this is a dynamic plot: mouse over links to reveal additional patterns.)

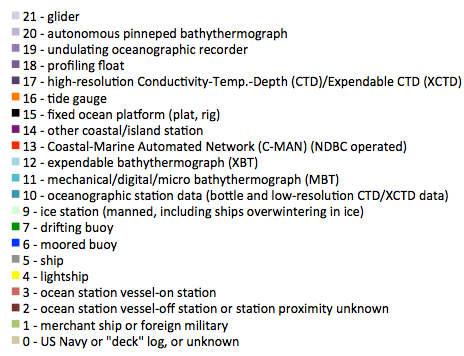
Figure 1-2. Beta4 percentage per deck and source ID new in Release 3 (bars; left axis) of platform type (PT), ID indicator (II), and source exclusion flag (QCZ). Similarly the log10 of the total number of PT, II, or QCZ (line; right axis). The white portion of bars denotes missing. (Note: this is a dynamic plot: mouse over links to reveal additional patterns.)
2. Duplicate Elimination
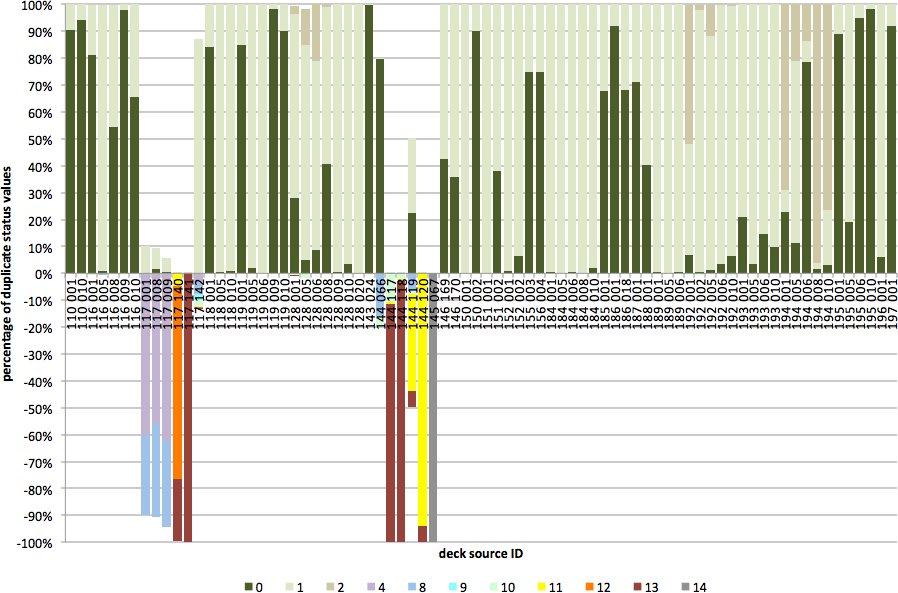
Figure 2-1. Beta4 percentage of duplicate status (DUPS) values per deck (110-197, 197-715, 720-889, 889-999) and source ID. These are all DUPS entries that appeared where "CERTAIN" and "UNCERTAIN" pertain to the "WEATHER ELEMENT" certainty (number of weather elements in common and number different among W, VV, WW, W1, SLP, AT, and SST):
     0 UNIQUE
     1 BEST DUPLICATE
     2 BEST DUPLICATE WITH SUBSTITUTION
     4 UNCERTAIN WEATHER ELEMENT
     8 CERTAIN WEATHER ELEMENT
     9 UNCERTAIN WEATHER ELEMENT WITH TIME/SPACE
    10 CERTAIN WEATHER ELEMENT WITH TIME/SPACE
    11 TIME/SPACE/ID
    12 UNCERTAIN WEATHER ELEMENT WITH TIME/SPACE/ID
    13 CERTAIN WEATHER ELEMENT WITH TIME/SPACE/ID
    14 AUTOMATIC REJECTION
DUPS values 0-2 are plotted as positive percentages, because reports with those DUPS values are output into the final user file; whereas, DUPS values >2 are eliminated from the final user file, and thus plotted as negative percentages.
(Note: this is a dynamic plot: mouse over links to reveal additional patterns.)
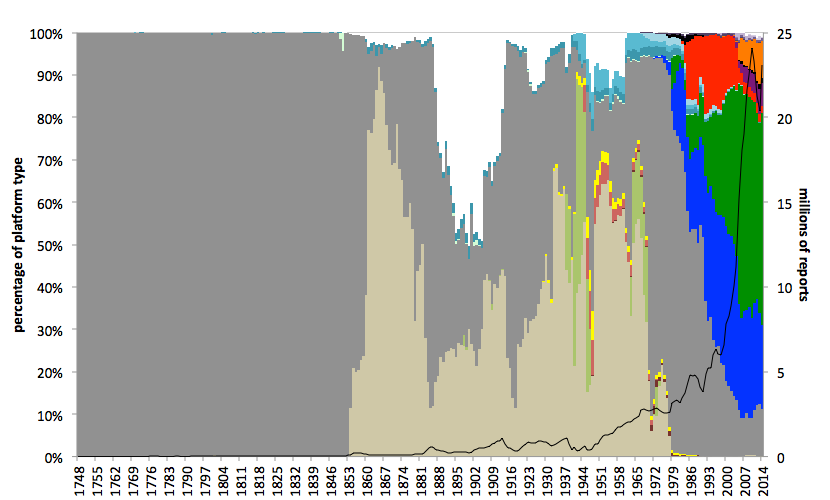
Figure 2-2. Beta4 percentage (bars; left axis) of platform type (PT) values and number of reports (line; right axis) per year. Similarly for number of platform type values. (Note: this is a dynamic plot: mouse over links to reveal additional patterns.)
3. Map comparisons
Figure 3. Beta4 decadal plots (1800-2014) illustrating data additions between Releases 1, 2.5, and 3.0. The colors show the total number of observations in a 2° box per decade separately for four primary variables (and using the enhanced monthly summaries derived using Release 1 trimming limits for both Releases 2.5 and 3.0). Plots for variables with no data in a decade have been omitted (note: Release 1 data began in 1854 and ended in 1979, Release 2.5 ended in 2007, and Release 3.0 ended in 2014).
4. 4-panel plots
Figures 4a through 4i provide 4-panel comparison plots between Release 2.5 and Release 3.0 Beta4 (2° enhanced monthly summaries derived using Release 1 trimming limits in both cases). For details on the 4-panel plot layout see icoads.noaa.gov/panels.html.
| sea surface temperature | air temperature | scalar wind | u wind component | v wind component | sea level pressure | total cloudiness | specific humidity | relative humidity | |
|---|---|---|---|---|---|---|---|---|---|
| 2° ENH | Figure 4a | Figure 4b | Figure 4c | Figure 4d | Figure 4e | Figure 4f | Figure 4g | Figure 4h | Figure 4i |
5. Unique report ID (UID)
Table 1. Release 2.5.1 is the original R2.5 with UIDs added (plus a few other changes), and Release 2.5.2 is a blend of the 2008-14 NCEP and NCEI near-real-time GTS data with UIDs added as follows. Note: all numbering refers to the "intermediate" files (or for R3.0.0 to the similar "total" files), which retain all duplicates and other suspect reports; whereas the final files have duplicates, landlocked reports, etc. removed).
| first UID | last UID | last UID - first UID + 1 | ||||
|---|---|---|---|---|---|---|
| Release (date) | POR | b36 | decimal | b36 | decimal | decimal |
| R2.5.1 (25 Jun 2012) | 1662-2007 | 000000 | 0 | 4VGZO4 | 294,725,524 | 294,725,525 |
| R2.5.2 (13 Nov 2014) | 2008-2014/08 | 4VGZO5 | 294,725,525 | CIPSY4 | 757,031,116 | 462,305,592 |
| R2.5.2 (3 Mar 2015) | 2014/09-12 | CIPSY5 | 757,031,117 | CZ3C7V | 784,536,475 | 27,505,359 |
| R3.0.0 (27 Jun 2016) | 1662-2014 | 000000 | 0 | KENQ7B | 1,233,945,191 | 1,233,945,192* |
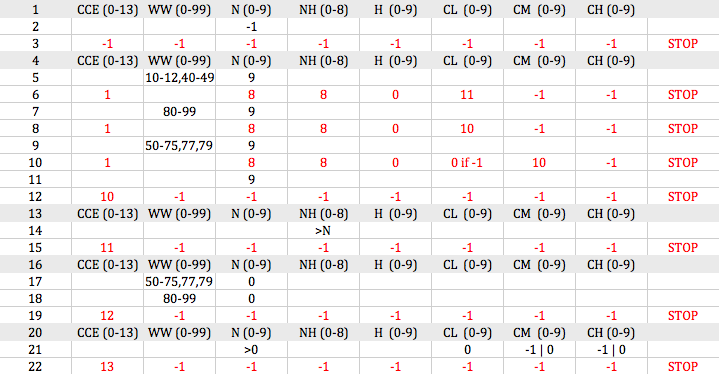
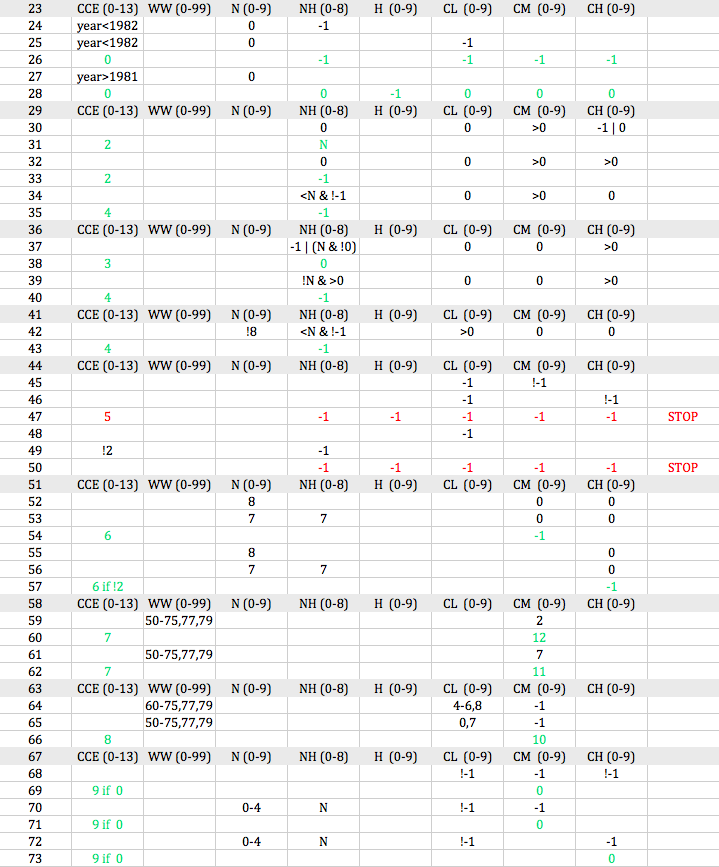
Appendix A: Edited Cloud Report (Ecr) attm
Differences between sample results produced by the {H99} (henceforth CDIAC) method (http://cdiac.ornl.gov/ftp/ndp026c/ship_199801_200812/DEC08i.Z), versus corresponding output from the original mkECRat.f (routines received from Carole Hahn 8/18/2008, which are being adapted to produce the IMMA Ecr attm), are documented below. Based on these results, some small errors were identified both in the CDIAC method (note: no software corresponding to this method has been located) and mkECRat.f software. In response, the software to produce the Ecr attm has been modified, but we no longer have any independent benchmark data on which to base further automated comparisons. Further information and software will however be provided here at a later date.
-
change code (CCE) = 1, AM UM UH ≠
S L L D W N C C C C S S Y M D HB A O Cs WN H H L M H A AUU C S R L A d SWHIdsawpr I R O Y RI T N Kt2 EE E E E E E M HMH E A I P W D T d TIIXffffff D DEC08i 20081201000 7390 8170 79262728 8 0 010-180090080 1-224 010245 60 70-1749009000191020002MASKSTID. 20081203001 35010550 79262608 8 0 610-180090000 1 152 -110090 31 10 275 34 310491110000MASKSTID. 20081204030 440034590 79262808 8 010-1-190090000 1-550 -210130139270 150 37 140391000000MASKSTID. mkECRat.f 20081201000 7390 8170 79262728 8 0 010-190090099 1-225 010245 60 70-1749009000191020002MASKSTID. 20081203001 35010550 79262608 8 0 610-190090099 1 153 -110090 31 10 275 34 310491110000MASKSTID. 20081204030 440034590 79262808 8 010-1-190090099 1-550 -210130139270 150 37 140391000000MASKSTID. -
relative lunar illuminance x100 (RI) ≠
S L L D W N C C C C S S Y M D HB A O Cs WN H H L M H A AUU C S R L A d SWHIdsawpr I R O Y RI T N Kt2 EE E E E E E M HMH E A I P W D T d TIIXffffff D DEC08i 20081206091 82012850 79262 26 4 6 2 7 290090099 0 7 1010110 31170 280 40 300491100000MASKSTID. 20081206211 4014400 79262157 5 4 2 6 890090099 0 101 -1210095 21 20 287 44 294391100000MASKSTID. 20081209091 269022330 79262 27-1-1-1-1-190090099 5-859 2310251 50330 190 349000191020000MASKSTID. 20081209091-3440 1650 79262503 3 2 4 8 790090000 0 640 -3010191144180 210 30 190491100000MASKSTID. 20081210211 3780 2350 79262-14 3 2 1 1 190090099 0-674 5910026 62160 140 40 200492000000MASKSTID. 20081211031 351032010 79262 36 6 5 4 2 0 0 000 0-765 5810364123 80 184 87 215494000000MASKSTID. 20081211091 310024340 79262 35 3 4 5 4 0320 020 0-704 5710165103 10 165 53 190491000000MASKSTID. 20081212031 436034570 79262 15 3 5 4 4-132090020 0-564 7410253170350 121 749000391020000MASKSTID. mkECRat.f 20081206091 82012850 79262 26 4 6 2 7 290090099 0 8 1210110 31170 280 40 300491100000MASKSTID. 20081206211 4014400 79262157 5 4 2 6 890090099 0 101 -1410095 21 20 287 44 294391100000MASKSTID. 20081209091 269022330 79262 27-1-1-1-1-190090099 5-860 2610251 50330 190 349000191020000MASKSTID. 20081209091-3440 1650 79262503 3 2 4 8 790090000 0 641 -3310191144180 210 30 190491100000MASKSTID. 20081210211 3780 2350 79262-14 3 2 1 1 190090099 0-675 6310026 62160 140 40 200492000000MASKSTID. 20081211031 351032010 79262 36 6 5 4 2 0 0 000 0-765 5410364123 80 184 87 215494000000MASKSTID. 20081211091 310024340 79262 35 3 4 5 4 0320 020 0-705 6210165103 10 165 53 190491000000MASKSTID. 20081212031 436034570 79262 15 3 5 4 4-132090020 0-565 6910253170350 121 749000391020000MASKSTID.RImkECRat.f - RIDEC08i frequency -5 10 -4 62 -3 174 -2 433 -1 10954 0 34267 1 9996 2 553 3 184 4 106 5 46 6 5 -
25 extra reports from mkECRat.f
S L L D W N C C C C S S Y M D HB A O Cs WN H H L M H A AUU C S R L A d SWHIdsawpr I R O Y RI T N Kt2 EE E E E E E M HMH E A I P W D T d TIIXffffff D DEC08i mkECRat.f 20081201121 -31028000 79262 56-1-1-1-1-190090099 5 129 010140 50350 235 299000191120200MASKSTID. 20081202121-2380 1530 79262 25 2 5 1 8 690090099 0 734 110151 77110 255 70 260391122201MASKSTID. 20081203061 2400 3470 79262 20 0-1 0 0 0 0 000 0 210 -110150 67100 265112 280491100100MASKSTID. 20081205080 -18030660 79262-14-1-1-1-1-190090099 0-187 -610100 5362 240 109000491022200MASKSTID. 20081205091 -19030620 79262 26 5 4 5 4 890090099 0 -53 -710120 5 40 250 7 300491021001MASKSTID. 20081205101 -21030600 79262-17-1-1-1-1-190090099 0 85 -710120 0361 251 89000491123333MASKSTID. 20081206050 -19030440 79262-10 0-1 0 0 0 0 000 0-577 -310115 0361 248 179000491022000MASKSTID. 20081206080 -21030390 79262-16-1-1-1-1-190090099 0-211 -910120 5362 233 49000491023233MASKSTID. 20081206091 -23030370 79262 16 3 2 1 5 990090099 0 -75 -1110120 0361 233 49000491023333MASKSTID. 20081206181 -25030340 79262 25 2 2 4 4-140090030 0 501 510120 0361 290 27 300491133333MASKSTID. 20081207050 -33030140 79262-17-1-1-1-1-190090099 0-584 -110120 0361 252 119000391023333MASKSTID. 20081207090 -30030040 79262 17 5 3 7 6-153390020 0-103 -1410120 5330 250 28 300391033333MASKSTID. 20081207090 -31030070 79262137 5 3 7 6-153390020 0-100 -1410120 5330 250 28 300391033333MASKSTID. 20081208081 2430 3460 79262 25 5 2 7 2 590090000 0 378 -1410154 0361 235105 260391100000MASKSTID. 20081209000 4490 5540 79262 11 0 9 0 0 5 010001 3-388 -310301 51200 68 49 61491000003MASKSTID. 20081209050 -27030220 79262-16-1-1-1-1-190090099 0-584 1010130 0361 238 69000391023333MASKSTID. 20081209091 -24030280 79262 12 1 2 1 2-111490010 0 -86 -2110130 0361 222 6 290391033333MASKSTID. 20081209111 -26030330 79262-14-1-1-1-1-190090099 0 196 -3210130 0361 230 69000391123333MASKSTID. 20081210091 -23030520 79262 12-1-1-1-1-190090099 0 -65 -2210100 -1 -1 257 12 290991033233MASKSTID. 20081210111 -24030510 79262-12-1-1-1-1-190090099 0 210 -4010100 -1 -1 250 439000991123233MASKSTID. 20081210201 -24030510 79262-13-1-1-1-1-190090099 0 222 510120 31 0 3309009000391123332MASKSTID. 20081211071 -14030800 79262-16-1-1-1-1-190090099 0-315 1110100 21362 254 159000391021200MASKSTID. 20081211091 -11030820 79262 16-1-1-1-1-190090099 5 -43 -1810100 0361 240 14 290391002000MASKSTID. 20081211121 -4030860 79262 13-1-1-1-1-190090099 5 367 -5710100 -1 -1 260 28 290991100200MASKSTID. 20081228000 245034530 79262 35 5 5 4-1-190090000 0-762 010125 40350 200 47 210091000000MASKSTID. -
caveat rf ≠
S L L D W N C C C C S S Y M D HB A O Cs WN H H L M H A AUU C S R L A d SWHIdsawpr I R O Y RI T N Kt2 EE E E E E E M HMH E A I P W D T d TIIXffffff D DEC08i 20081201001 520020720 79262 36-1-1-1-1-190090099 5 116 010237 46110 33133 50391100003MASKSTID. mkECRat.f 20081201001 520020720 79262 36-1-1-1-1-190090099 5 117 010237 46110 33133 50391100002MASKSTID. -
caveat D 0 = 360
          S    L    L   D   W  N   C C C         C            S                S
   Y M D HB    A    O   Cs  WN H H L M H  A  AUU C   S   R    L         A  d   SWHIdsawpr        I
   R O Y RI    T    N   Kt2 EE E E E E E  M  HMH E   A   I    P  W  D   T  d   TIIXffffff        D
DEC08i
20081201000  930 5560 79262 35-1-1-1-1-190090099 0-327   010115 87  0 260900 265391000002MASKSTID.
mkECRat.f
20081201000  930 5560 79262 35-1-1-1-1-190090099 0-327  -110115 87360 260900 265391000002MASKSTID.
References
{H99} Hahn, C.J., and S.G. Warren, 1999: Extended Edited Synoptic Cloud Reports from Ships and Land Stations Over the Globe, 1952-1996. NDP-026C, Carbon Dioxide Information Analysis Center, Oak Ridge National Laboratory, Oak Ridge, TN. (Also available from Data Support Section, National Center for Atmospheric Research, Boulder, CO.)
Appendix B: stationmetadata
-
Why are lat and lon sometimes different between activestations and stationmetadata?
http://www.ndbc.noaa.gov/station_page.php?station=fpkg1
32.035 N 80.903 W (32°2'5" N 80°54'11" W) [i.e., 32.03472N 80.90305W]

activestations.xml (created="2014-08-18T17:20:01UTC")
<station id="fpkg1" lat="32.035" lon="-80.903" elev="2.93" name="8670870 - Fort Pulaski, GA" owner="NOS" pgm="NOS/CO-OPS" type="fixed" met="y" currents="n" waterquality="n" dart="n"/>

stationmetadata.xml (created="2014-08-18T05:00:02Z")
<station id="FPKG1" name="8670870 - Fort Pulaski, GA" owner="NOS" pgm="NOS/CO-OPS" type="fixed">
  <history start="2004-09-20" stop="" lat="32.033" lng="-81.902" elev="0" met="y" hull="" anemom_height="6.7"/>
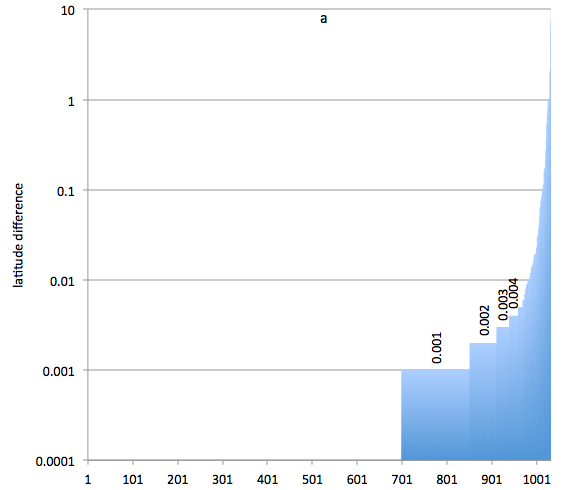
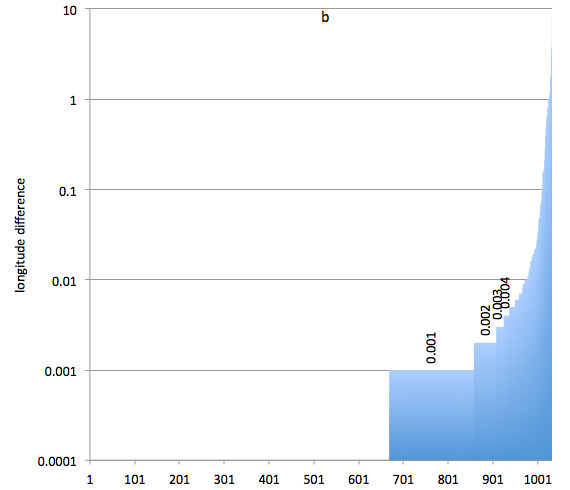
Figure B1. NDBC buoy/coastal station latitude (a) and/or longitude (b) differences between activestations and stationmetadata (absolute value; logarithmic scale). Space to the left of the 0.001 bar shows the number with no difference.
-
Why are some stations in activestations and not in stationmetadata?
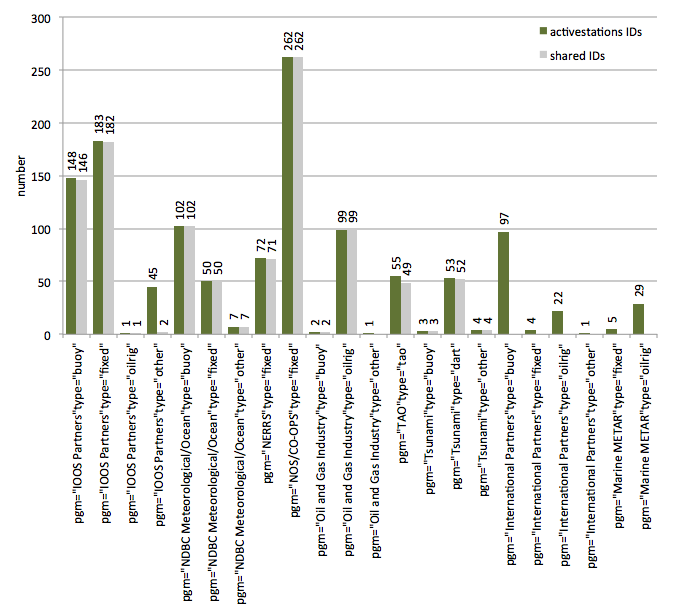
Figure B2. Numbers of NDBC buoy/coastal station IDs, per "pgm" and "type" combination (according to activestations), in activestations, and of those, how many stations are shared between activestations and stationmetadata (grey).
Appendix C: Release 2.5.2 2008-14
Release 2.5.2 is a blend of the 2008-14 NCEP and NCEI near-real-time GTS data with UIDs added. Since GTS formats CMAN and CREX do not contain location, latitude and longitude were acquired from activestations.xml (2013-14) or stationmetadata.xml edited1 (2008-12). If ID was missing in these files, an NCEP location was used for NCEP data but NCEI data were discarded.
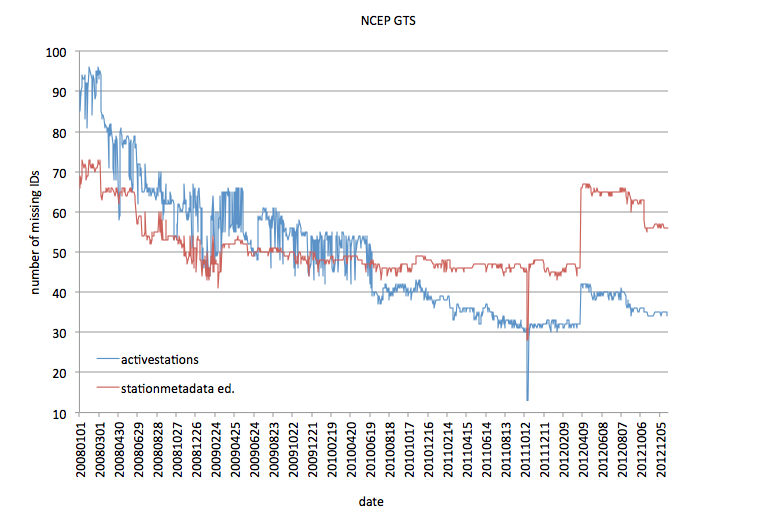
Figure C1. Number of IDs missing per day 2008-12 in activestations2 versus stationmetadata ed. of NCEP GTS data in the CMAN or CREX formats. The 20111020-24 dip does not correspond to a dip in data volume (see Fig. C3).
Table C1. IDs most often missing in stationmetadata ed. of NCEP GTS data in the CMAN or CREX formats and NCEI GTS data in the CMAN format. NCEP numbers refer to days missing 2008-12 (1827 days) and NCEI numbers to months in which ID was missing at least once mutiplied by 31 (1798 days due to data problems in 2008/2 and 2008/43, see Fig. C3).
| ID | NCEP CMAN | NCEP CREX | NCEI CMAN | total |
|---|---|---|---|---|
| DPIA1 | 1827 | 1798 | 3625 | |
| FPKG1 | 1827 | 1798 | 3625 | |
| FPTM4 | 1827 | 1798 | 3625 | |
| PNGW3 | 1827 | 1798 | 3625 | |
| SGNW3 | 1827 | 1798 | 3625 | |
| THRO1 | 1823 | 1798 | 3621 | |
| LOPW1 | 1821 | 1798 | 3619 | |
| NIWS1 | 1818 | 1798 | 3616 | |
| WEXM1 | 1807 | 1798 | 3605 | |
| QPTR1 | 1792 | 1798 | 3590 | |
| RSJT2 | 1758 | 1798 | 3556 | |
| SANF1 | 1785 | 1767 | 3552 | |
| OCPN7 | 1730 | 1798 | 3528 | |
| CHII2 | 1681 | 1736 | 3417 | |
| APNM4 | 1588 | 1736 | 3324 | |
| SISA2 | 1556 | 1736 | 3292 | |
| VAKF1 | 1759 | 1426 | 3185 | |
| TCMW1 | 1329 | 1581 | 2910 | |
| PBPA2 | 1003 | 1085 | 2088 | |
| SHNO3 | 1827 | 1827 | ||
| VAPW1 | 1825 | 1825 | ||
| WAUO3 | 1819 | 1819 | ||
| CKYF1 | 1818 | 1818 | ||
| FTPN3 | 1804 | 1804 | ||
| YABP4 | 273 | 1519 | 1792 | |
| SKAW1 | 1775 | 1775 | ||
| CHTS1 | 1752 | 1752 | ||
| WLON7 | 1750 | 1750 | ||
| KWHH1 | 1689 | 1689 | ||
| ESPP4 | 273 | 1302 | 1575 | |
| WI015 | 1569 | 1569 | ||
| MI210 | 1388 | 1388 | ||
| WI020 | 1388 | 1388 | ||
| MI145 | 1387 | 1387 | ||
| MI200 | 1386 | 1386 | ||
| TX035 | 1385 | 1385 | ||
| WI040 | 1384 | 1384 | ||
| NY042 | 1383 | 1383 | ||
| MI230 | 1379 | 1379 | ||
| MI010 | 1376 | 1376 | ||
| MI250 | 1372 | 1372 | ||
| MI220 | 1370 | 1370 | ||
| MI221 | 1353 | 1353 | ||
| PA012 | 1349 | 1349 | ||
| WI010 | 1338 | 1338 | ||
| MI257 | 1282 | 1282 | ||
| MI016 | 1174 | 1174 | ||
| MI260 | 1174 | 1174 | ||
| MI256 | 1164 | 1164 | ||
| MI255 | 1007 | 1007 |
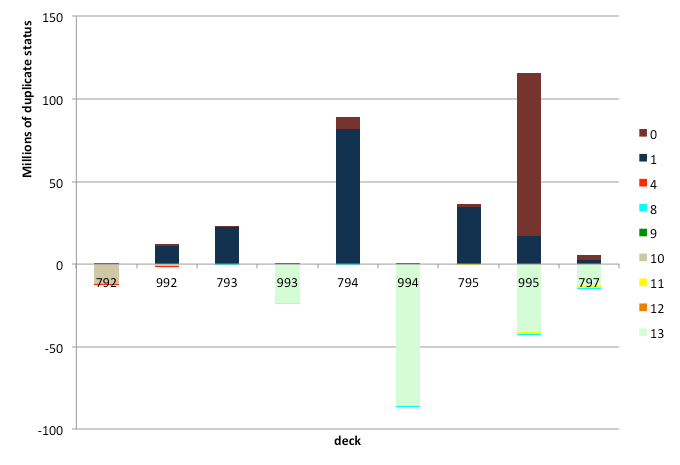
Figure C2. Duplicate elimination intermediate output 2008-2014/8 (bars) by duplicate status (colors) per GTS source and format (horizontal axis): final output above the zero line and worse duplicates eliminated from final output below. Deck does not necessarily reflect platform type (see Fig. C4).
  deck                                                                      duplicate status
  792 NCEP GTS: Ship Data                                                    0  unique
  992 NCEI GTS: Ship Data                                                    1  best duplicate
  793 NCEP GTS: Buoy Data (transmitted in FM 13 "SHIP" code)                 4  uncertain weather element
  993 NCEI GTS: Buoy Data (transmitted in FM 13 "SHIP" code)                 8  certain weather element
  794 NCEP GTS: Buoy Data (transmitted in FM 18 "BUOY" code)                 9  uncertain weather element with time/space
  994 NCEI GTS: Buoy Data (transmitted in FM 18 "BUOY" code)                10  certain weather element with time/space
  795 NCEP GTS: Coastal-Marine Automated Network (C-MAN code) Data          11  time/space/id
  995 NCEI GTS: Coastal-Marine Automated Network (C-MAN code) Data          12  uncertain weather element with time/space/id
  797 NCEP GTS: CREX code                                                   13  certain weather element with time/space/id
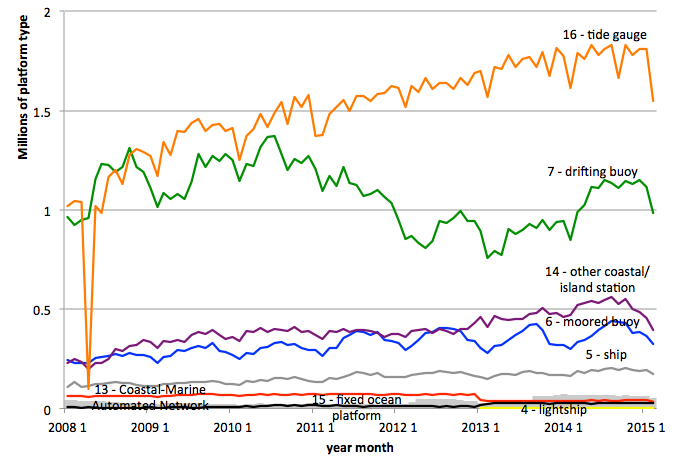
Figure C3. Platform types per month3 determined by stationmetadata ed. 2008-12 and multiple activestations files 2013-2015/2 of final output. Lightship platform type was identified only by activestations. Gray bars are number of platform type missing and colored lines are number of:
  yellow    4 - lightship
  gray      5 - ship
  blue      6 - moored buoy
  green     7 - drifting buoy
  red      13 - Coastal-Marine Automated Network (C-MAN) (NDBC operated)
  purple   14 - other coastal/island station
  black    15 - fixed ocean platform (plat, rig)
  orange   16 - tide gauge
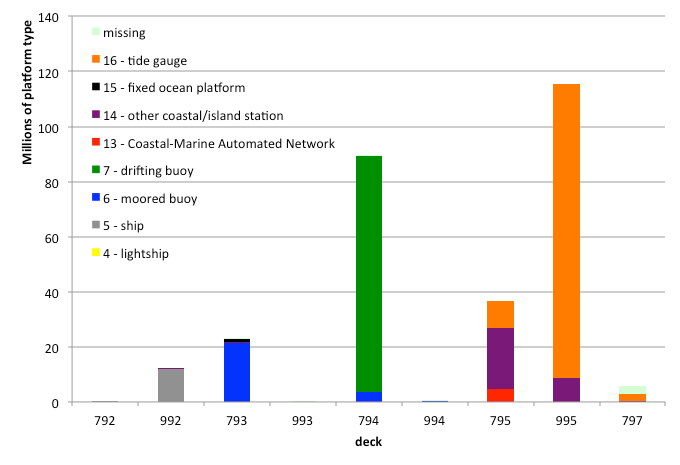
Figure C4. Platform types per deck of final output 2008-2014/8.
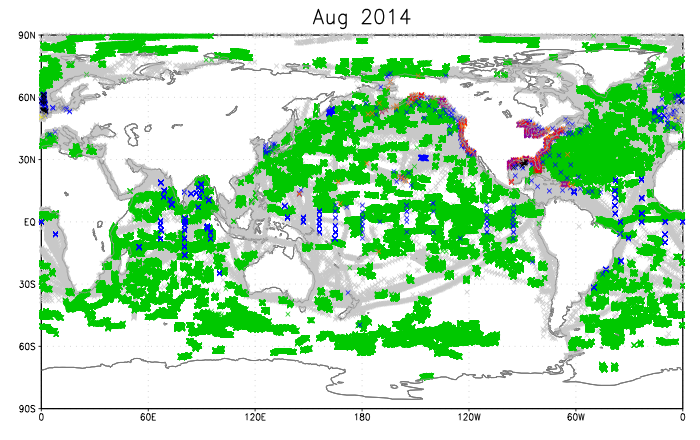
Figure C5. August 2014 final output platform types 4 - lightship (c. 50°N 0°E), 5 - ship, 6 - moored buoy, 7 - drifting buoy, 13 - Coastal-Marine Automated Network, 14 - other coastal/island station, 15 - fixed ocean platform, and 16 - tide gauge.
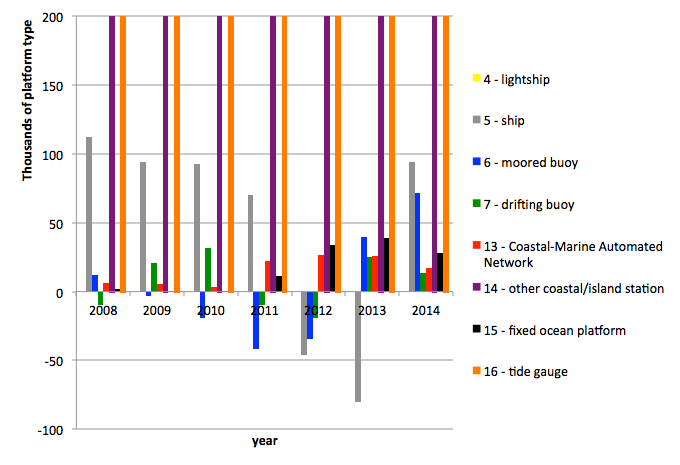
Figure C6. Thousands of platform types per year of final output 2008-2014/8 minus NCEP (except deck 797) input. Duplicates within the NCEP data decrement the bars of additional NCEI data. Negative ship values occur during the Canadian duplicates time period (see merge Examples 1.1). Negative buoy values are explained by NCEP BUOY format data with duplicate statuses of 8:
                         A                                               W    D                              A A               D
                L     L  T     N                               S   P     B   WP   D     S                    T TB  B    D  S   U
   Y M D   H    A     O ITTLDV I I        I CD   W   V V WW    L   PI   AT   BT   P S   S NCH CC W W W S S S T TS  1 B  C  I P P
   R O Y   R    T     N MCIISS D I        D 1I  DI  WI V W1    PA  PT   TI   TI   T I   TNHLIHMH D P H D P H I LI  0 1  K  D T S
2011 7151200 -186 26447 1325     332322      01504 82               0 227     1 204   227                    165 34815794103 6 8
2011 7151200 -186 26447 1325     332322      01504 82               0 227     1 204   227                    165 34815994114 613
2011 7151200 -186 26448 1325     332322      01504 82               0 227     1 204   227                    165 34815794103 6 1
2011 7151200 -186 26448 1325     332322      01504 82               0 227     1 204   227                    165 34815994114 613

2011 7 71100-5585 22583 1225     371568                    101967  40                  13                    165 52454794103 7 8
2011 7 71100-5585 22583 1225     371568                    101967  40                  13                    165 52454994114 713
2011 7 71100-5587 22586 1225     371568                    101967  40                  13                    165 52454794103 7 1
2011 7 71100-5587 22586 1225     371568                    101967  40                  13                    165 52454994114 713
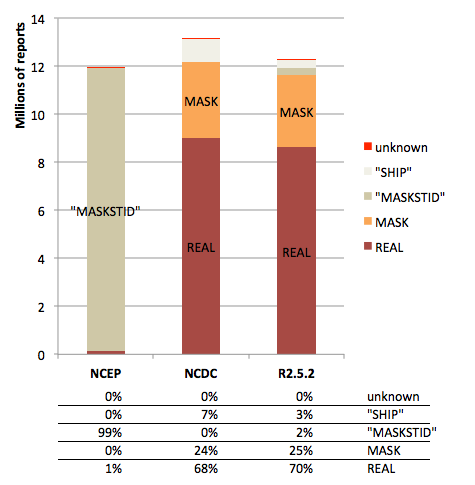
Figure C7. ID patterns in NCEP and NCEI input and final output 2008-2014/8. A mask ID is of the form [A-Z][A-Z][A-Z][A-Z][A-Z][0-9][0-9].
1stationmetadata created="2014-08-18T05:00:02Z" edited to remove 54 stations that did not match activestations2 at 0.1° resolution (i.e., APNM4, CHII2, DPIA1, ESPP4, EVMC1, FPKG1, FPTM4, FRFN7, LOPW1, MAQT2, PBLW1, PBPA2, PNGW3, QPTR1, RSJT2, SANF1, SGNW3, SISA2, TCMW1, THRO1, VAKF1, WEQM1, WEXM1, 21402, 21414, 41037, 41052, 41060, 41NT0, 42099, 42361, 42362, 42369, 42382, 42387, 42877, 42889, 42899, 42921, 42927, 42930, 43412, 45004, 46229, 46246, 46248, 46407, 51000, 51003, 54401, 55012, 55015, 56001, 56003).
2activestations.xml created="2014-08-18T17:20:01UTC"
3 NCEI CMAN format data were missing 2008/4; 2008/2 data had recurring receipt headers of "13 Feb 2008 11:53" including erroneous days 30-31 which resulted in ID being "missing" in stationmetadata.
Appendix D: US National Data Buoy Center (NDBC) delayed mode data (deck 883) versus GTS sources (decks 793/993)
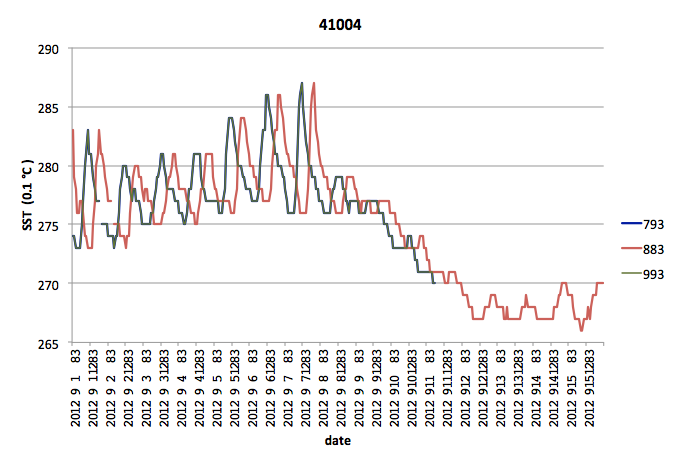
Figure D1. Sea surface temperature (air temperature, sea level pressure) per date (the labeling on the horizontal axis represents YYYYMMDDHHHH with hour to hundredths) of Release 2.5.2 GTS decks 793 and 993 (the deck 793 curve falls under the deck 993 curve with both missing after 2012/09/11 5.83 UTC) and delayed mode deck 883 buoy 41004. And similarly for buoy 51000 (sea surface temperature, air temperature, sea level pressure) and C-MAN TPLM2 (sea surface temperature, air temperature, sea level pressure) (the decks 793(5) and 993(5) curves are identical and the deck 883 curve never missing). The 41004 deck 883 lag may be related to inconsistent hour between GTS groups YYGGiw and 9GGgg (see Fig. D3):
BBXX01090120120903SNVD01KWBC010800RRN////// 41004 01081 99325 70791 46/// /2603 10268 20232 40205 56007 90050 22200For reference from the WMO Manual on Codes No. 306, relevant regulations regarding these date/time groups:
"12.1.6 The actual time of observation [i.e. GG from YYGGiw] shall be the time at which the barometer is read.
[...]
12.2.8 Group 9GGgg
This group shall be included:
(a) When the actual time of observation differs by more than 10 minutes from the standard time GG reported in Section 0;
(b) When additionally specified by regional decision.
Note: See Regulation 12.1.6."
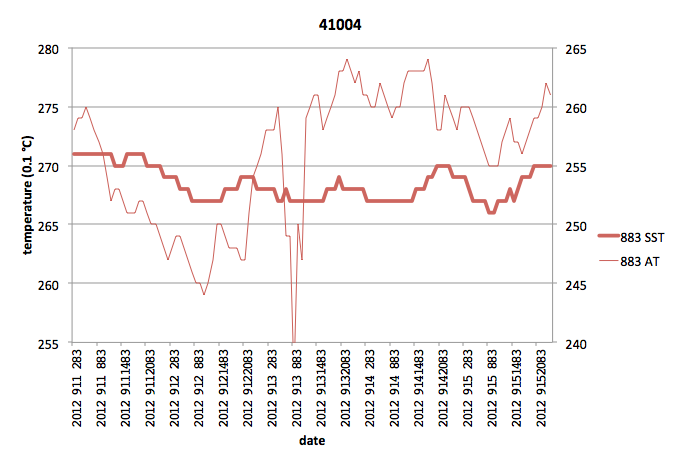
Figure D2. A zoom in on the end of Fig. D1 showing a possible moving threshold for SST identified by Liz Kent of the UK National Oceanography Centre (see also Fig. D1, 51000, SST).
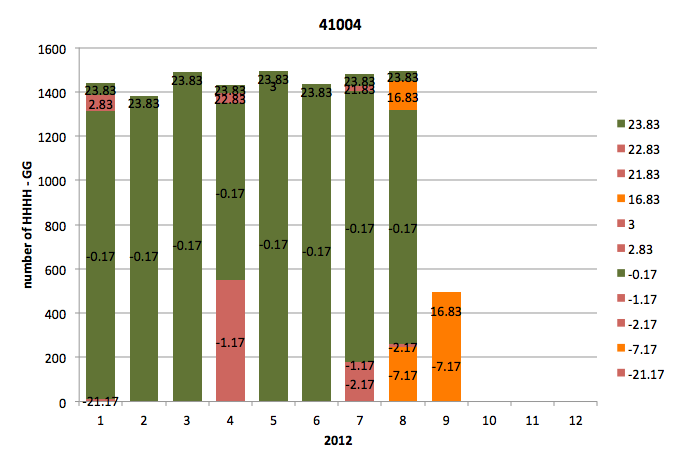
Figure D3. 41004 GTS hour to hundredths minus GTS whole hour per month in 2012. 41004 was the only ID in 2012/09 of Release 2.5.2 intermediate output with a pattern of inconsistent hour (see Fig. D1) and that pattern in 41004 was limited to 2012. Expected differences are -0.17 and 23.83.
Appendix E: Global Tropical Moored Buoy Array (GTMBA)
Table E1. Release 2.5 Pacific Marine Environmental Laboratory (PMEL) decks and number of reports.
| Deck | Description | Start | End | Rpts K |
| 144 | TAO/TRITON and PIRATA Buoys (from PMEL & JAMSTEC)2 | 1985 | 2004 | 7,192 |
| 145 | PMEL (Daily) Equatorial Moorings and Island Stations2 | 1979 | 1991 | 17 |
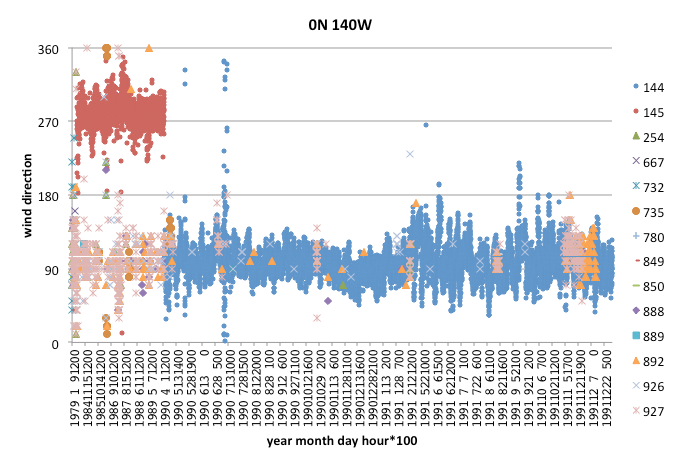
Figure E1. Release 2.5 wind direction (from; meteorological convention) within 1° of 0°N 140°W (easterly trade winds) by deck. Erroneous wind direction (to; oceanographic convention) in deck 145 was discovered by Liz Kent of the UK National Oceanography Centre.
Appendix F: Climatological Database for the World's Oceans (CLIWOC)
Release 2.5 deck 730 (not subject to duplicate elimination) IDs are right-justified:
                         A                                               W    D                              A A
                L     L  T     N                               S   P     B   WP   D     S                    T TB  B    D
   Y M D   H    A     O ITTLDV I I        I CD   W   V V WW    L   PI   AT   BT   P S   S NCH CC W W W S S S T TS  1 B  C
   R O Y   R    T     N MCIISS D I        D 1I  DI  WI V W1    PA  PT   TI   TI   T I   TNHLIHMH D P H D P H I LI  0 1  K
1793 8 1 300  -21 13835 1306    10     1085FR  935 67                                                        165 335 8730
1793 8 11200 7530   135 1306    10      825NL  84                                                            165  7051730
1793 8 11400 3780 32438 1306    10     1545UK 262                   7 250                                    165 21075730
1793 8 11400 3777 32464 1306    10     1858NL 206                                                            165 21075730
1793 8 11400 1220 33502 1306    10     1117UK  455 26               7 258                                    165 28324730
1793 8 11400-1577 32753 1306    10      546ES 1105 93                                                        165 39052730
[Data and Documentation][Documentation and Software]
U.S. National Oceanic and Atmospheric Administration hosts the icoads website privacy disclaimer
Document maintained by icoads@noaa.gov
Updated: Jul 20, 2016 18:16:38 UTC
http://icoads.noaa.gov/r3.html