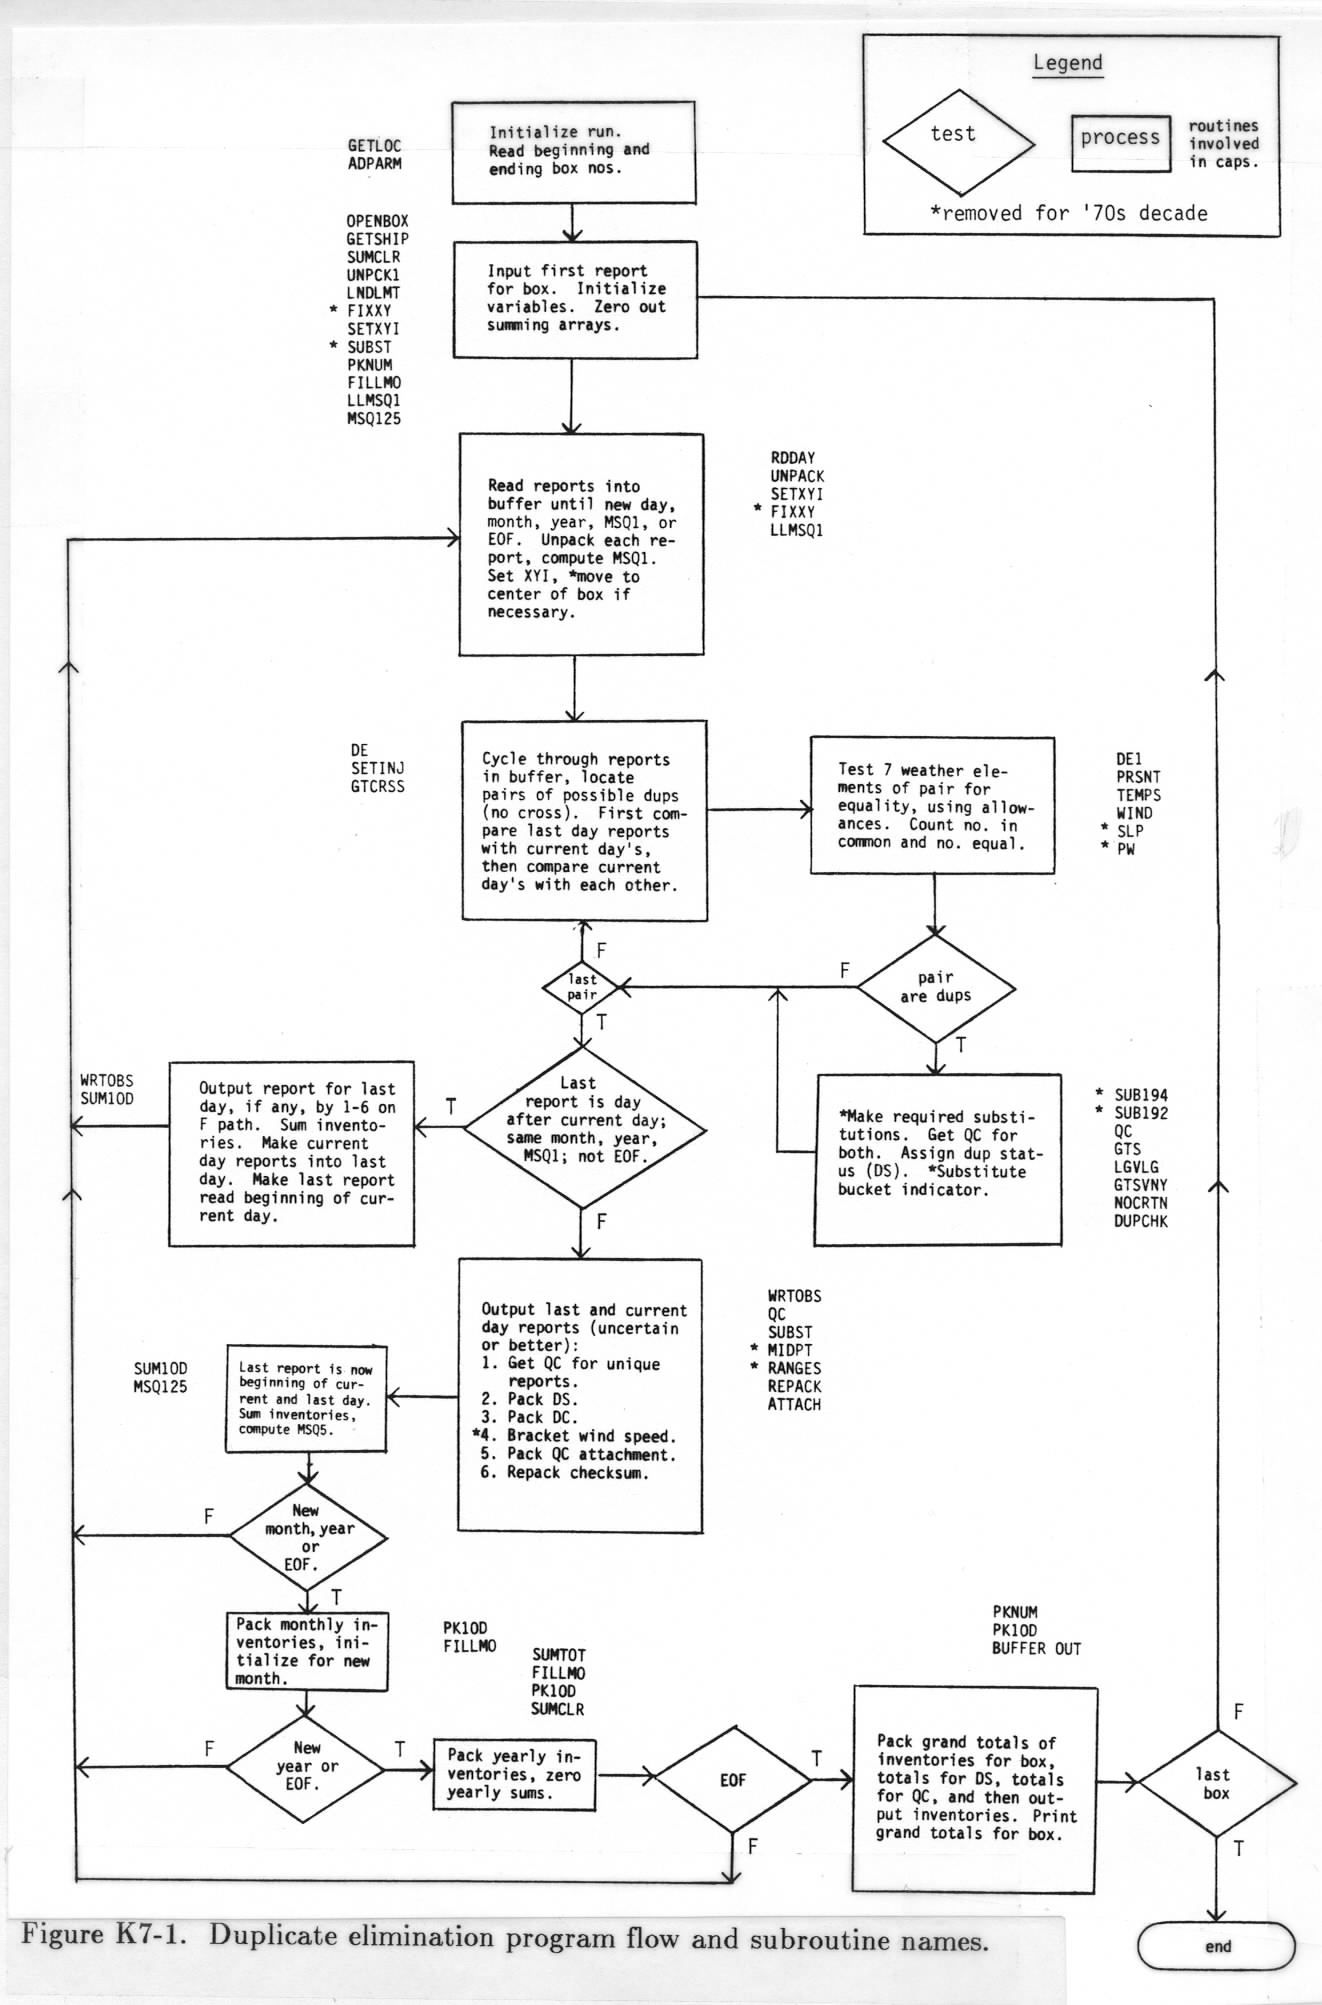
Figure K7-1. Duplicate elimination program flow and subroutine names.
0. Introduction
Merging several different marine data sets into one file would ideally be a very simple task. Duplicate reports could easily be identified by exact comparison of location, time, and weather fields. Unfortunately, slightly different conversion techniques and interpretations have made duplicates more difficult to locate. In many cases, reports that were once exactly the same now have random or systematic differences in one or more of their fields. To effectively eliminate all duplicates, the data problems that develop from differing or erroneous processes must be identified by flexible computer checks.
Four main checks can be performed between two reports to identify duplicates (dups): 1) the report's location, 2) date, 3) time, and 4) the individual weather parameters observed. A stringent duplicate elimination (dupelim) plan would require all four checks to show an exact match, for two marine reports to be considered dups. However, if errors or differences do exist in some marine data sets, reports that were actually dups could be considered unique.
The dupelim procedures developed for this project were designed to allow less stringent computer checks on the location, date, time, and weather parameters. These tests were based upon known data base errors, the history of each data set, and anticipation of errors that could occur. Initially, dupelim was divided into two categories: "hard" and "easy" procedures. Easy dups are those reports that match exactly in date, time, and location. Hard dups have some type of problem in location or time fields, caused by different conversion techniques, erroneous procedures, etc.
After consideration of the historical background of each data set (sec. 1), both hard and easy dupelim computer programs were prepared and run on selected data sets. Hard procedures were run individually to check on the Atlas against most of the other TD-11 data sets. These procedures and the test results are described in sec. 2. Easy procedures were run on nearly all TD-11 data sets (except the Atlas) merged into one file. These procedures and the test results are described in sec. 3. Through this extensive testing, it was decided to combine hard and easy dupelim plans into one. This was done to simplify and streamline the final production program. The resulting dupelim specifications are described in sec. 4; later refinements are described in sec. 5. Sec. 6 describes changes made in the final procedures for data during 1970-1979. The production FORTRAN program used is described in sec. 7.
1. Data Set Histories
In the 1940s and 1950s the United States acquired several foreign sets of keypunched historical ship reports. The card decks were received from a variety of sources and by a variety of methods. For example, the German deck 192 was captured by the Allies during World War II. Decks 193 and 194 were sent to the United States by the Dutch and British, respectively. Reports in these historical decks ranged as far back as the 1850s and were a valuable addition to a growing marine data base. Unfortunately, data sets were keypunched in entirely different formats. It was therefore impossible to merge the card decks into one file and sort the resulting data base.
In the 1960s it was decided to convert all these independent card decks into one format. This was the beginning of Tape Deck-11 (TD-11) and turned out to be a tremendous programming effort, almost exclusively in COBOL. By the late 1960s, more than 15 independent card decks were at NCDC, totaling about 40 million reports. Each deck had certain unique characteristics and observing methods. To further complicate matters, observing practices changed at specific (or sometimes unknown) time periods for some decks. This resulted in very complicated computer programs, and some hidden errors crept into the original data base.
The WMO-sponsored Historical Sea Surface Temperature (HSST) Data Project was begun in the early 1970s and continued into the 1980s. Marine data were processed independently for the Pacific (United States), Atlantic (Federal Republic of Germany), and Indian (Netherlands) Oceans. Some of the HSST data were unique and not in the original TD-11 data base. However, many HSST data had already been acquired by NCDC in the 1940s and 1950s. Differences were found between the HSST data and the dups in the TD-11 data base. Reports that were once exactly the same now had differences in one or more of the fields that made up the report.
The Navy Marine Atlas Project was started by NCDC in the early 1970s as a special project. This project merged all readily available marine reports into one file, called the Atlas. In addition, this project also attempted to "clean-up" specific inconsistencies found in marine data. Weather, location, and time fields in certain card decks were changed to help rectify errors and biases created during the original conversion to TD-11. Unfortunately, these changes made dups more difficult to locate when the same data were again received from another source.
Towards the end of 1981, a second revision of the '70s Decade data set was completed by NCDC, which follows the Atlas with comparable coverage of the period from 1970 through 1979. Some obvious error corrections were performed, but data that failed quality control procedures were generally flagged instead of changed.
After the completion of these projects, several other data sets became available that make the historical ocean-atmosphere record more complete. COADS is a blend of all these data, after quality control and dupelim.
The history of each marine data set played a major role in the development of dupelim procedures. Therefore, a brief historical description is given for each data set included (see Table 1-1 in COADS Release 1). Many of the problems found by dupelim testing can be better understood by knowing the origin and processing details of the data sets involved.
1.1 Atlas
The Atlas file was created in the 1970s as part of the Navy Marine Atlas Project. This project merged all readily available surface marine reports into one file from which later analysis was used to produce a set of marine atlases, such as [11]. The largest source of data was the original TD-11 data set created in the late 1960s. Other data came from certain supplemental TD-11 files. The HSST data set was not included except for a large area in the South Pacific (10°N to 60°S; 70°W to 160°W).
The Atlas project also attempted to "clean-up" inconsistencies found in marine data. Internal consistency checks were made for each report during the quality control (QC) process. Occasionally, weather parameters were changed to describe the observed weather conditions better. For example, present weather was changed in specific decks in order to conform to the observed visibility. Dups became more difficult to locate because of these changes.
Because of a 1981 merge of all then-available 1970s data into the '70s Decade, the Atlas was truncated at 1969.
1.2 Australian
CIRES acquired this data set from the Australians in 1981. The reports cover the period from the 1930s through the late 1970s and were received in "Ship Logs Data Archive Format." A computer program was written at NCDC as part of this project, to convert the Australian format to TD-11. Deck 900 was assigned to this data set.
Most of the individual fields were directly transferred from the Australian format to TD-11. However, Marsden Square (MSQ), 1° MSQ, and dew point temperature were computed. Quadrant was changed from the WMO standard to NCDC standard. In addition, the wind speed indicator and sea surface temperature observation method indicator were changed to conform to TD-11. A "9" in either of these fields meant the indicator was unknown.
A few problems were found in the wave data fields. A frequency distribution program was written to determine if the Australians had correctly converted the wave data fields after WMO changed reporting practices in January 1968. This revealed an error in Australian data processing causing all wind wave periods before 1968 to be incorrectly converted to seconds. Instead of using the pre-1968 WMO code they used the 1968 code. All wind wave periods before 1968 were therefore corrected using the WMO standard.
A few other minor changes were made in the wave period fields in
order to conform to then-current WMO practices. All wind wave periods
(1968 and after) were put in whole seconds in addition to the coded
values. All second swell periods for 1968 and later (coded by the
Australians) were changed to whole seconds and moved into TD-11. The
scheme for this conversion is given in Table K1-1.
    Code            Seconds
(Australian)        (TD-11)
--------------------------------
     5            5 and less
     6                 6
     7                 7
     8                 8
     9                 9
     0                10
     1                11
     2                12
     3                13
     4          14 and greater
--------------------------------
1.3 Buoy Data
This file is a collection of reports from automatic observing buoys operated mainly by NOAA during the '70s, except for some buoys that were part of special scientific projects. Different deck numbers were used to classify buoys by size, shape, or instrumentation. Buoy data now received by NCDC from NDBC (NOAA Data Buoy Center) are no longer separated into different decks, although an individual buoy number, indicative of location and other information, is usually available. The quality of the data is generally higher than that of ship data [8], although these data may have been subject to processing errors in the past.
1.4 Ship Eltanin
The ship Eltanin was operated by the National Science Foundation in the Antarctic region from 1962 to 1973. It was given to the Argentine Navy in 1974. The Argentines operated the ship through 1979 and renamed it Islas Orcadas. The ship is now laid up in Norfolk, Virginia.
Surface synoptic reports (four per day) were taken aboard Eltanin for the entire time period. It seemed likely that these reports were sent to NCDC and incorporated into TD-11 and hence into the Atlas data base. To check this assumption, Atlas data from 28 MSQs were selected from the area south of 30°S in the vicinity of South America and Australia. This area contained 2,333 reports, a significant portion of the Eltanin data set. The reports were visually compared against [2], published source of Eltanin's cruises covering the period April 1962 through October 1968. From this comparison the following was discovered: 1) the Eltanin was assigned ship number "0027" in TD-11, 2) all reports between April 1962 and June 1963 were assigned to deck 116, 3) all reports between August 1963 and October 1968 were assigned to deck 128, 4) some Eltanin reports (about 100) between June 1962 and June 1963 were found missing in the Atlas, and 5) it is unknown whether Eltanin ship reports are in the Atlas after 1968 because [2] went through only 1968.
Since items 4) and 5) indicate apparently missing data, it was decided to locate the original Eltanin ship logs and re-keypunch the missing periods. Unfortunately, these synoptic reports could not be found in NCDC archives. Since this was a special ship, the original records have apparently been stored in a special collection. Therefore, the missing Eltanin reports for the period June 1962 to June 1963 were re-keypunched from [2]. This resulted in the loss of sea surface temperature and wave parameters since these fields were not published. The status of the data after 1968 remains unknown at this time.
While synoptic records were being sought, a set of oceanographic reports from Eltanin was found in NCDC archives, composed primarily of just sea temperature. Apparently, synoptic and oceanographic reports were independently made aboard this vessel. Between the synoptic and oceanographic reports made at the same time, there were usually minor differences in latitude, longitude, and sea surface temperature. These XBT or MBT oceanographic reports are explained more fully under the NODC history (sec. 1.11). However, it does appear that XBT or MBT Eltanin reports are in the Atlas under deck 891.
1.5 HSST
In the early 1970s, the Historical Sea Surface Temperature (HSST) Data Project was begun. Surface marine data were collected and processed independently for the Pacific (United States), the Atlantic (Federal Republic of Germany), and the Indian Ocean (Netherlands). Renewed interest in historical ship data resulted in backpunching of some older data that were not in NCDC's data base. Many HSST data, however, had already been acquired by NCDC in the 1940s and 1950s and were therefore duplicate with the TD-11 file.
Once all marine reports were collected, the data were exchanged between countries in a compacted Exchange format (described by supp. I), which contained only selected elements. Unfortunately, this format did not have a field for data source. This lack of source identification created a problem because many differences in processing were found between the United States sets acquired in the 1940s and 1950s, and the duplicate HSST data processed by the various countries. Therefore, the erroneous processes could not be identified unless a dup in the Atlas matched the HSST report. These differences made documentation and dupelim very difficult for the HSST data set.
1.6 IMMPC (International Maritime Meteorological Punch Card)
IMMPC data are received by NCDC on a continuing basis from several different countries designated by WMO as data collectors. Each collector is responsible for collecting marine data from a specific geographic area and then exchanging these data with the other collectors. All data are exchanged in an IMMPC format specified by WMO and include contemporary and, when available, historical marine reports.
In June 1982, several errors were found in the computer program that converted IMMPC data to TD-11. These errors forced all data processed since January 1982 to be reprocessed using a corrected version of this program. The TD-11 data set was re-sent to CIRES in December 1982 under deck 926, after corrections.
1.7 Japanese
This data set was acquired from Japan by M.I.T. during 1975 and sent to NCDC by CIRES for conversion. Observations were taken by the Japanese whaling fleet and other Japanese ships, primarily in the polar region of the Southern Hemisphere. All reports were sent in an IMMPC format that required conversion to TD-11 by NCDC. Several errors were found in the conversion program after the data had been processed and sent to CIRES. These errors forced all data to be reconverted using a corrected version of the program. A corrected magnetic tape was sent to CIRES in December 1982 under deck 926. Since this deck number was the same as another IMMPC data set, CIRES changed the deck number of all reports to 898.
Note: The two words added above in red correct the original published edition of COADS Release 1.
Three internal problems were found in some reports that required preprocessing. Two of the three problems involved illegal overpunches in the longitude and temperature fields. The third problem involved some dew point temperatures (about 3%) erroneously sent in degrees Fahrenheit. To ensure that a double conversion to degrees Celsius would not occur, the following procedure was used to identify dew point temperatures in degrees Fahrenheit.
If dew point was greater than dry bulb (air temperature), the report was written to a separate file for visual inspection. From this inspection, it was determined that all dew points should be converted to Celsius if the difference between the dew point and the dry bulb was greater than or equal to 10°. For example, if the dew point was 31.8° and the dry bulb was 1.1°, the dew point was converted to Celsius because the difference was greater than the arbitrary 10° tolerance.
1.8 MSQ 486 Pre-1940
Data from a portion of MSQ 486 were lost at some stage of processing when the Atlas was created. The error was found by comparing inventories of the original marine data base and the subsequent Atlas file. This revealed that many reports were missing before 1940 from MSQ 486. The error probably came about in the selection process. Pre-1940 data for MSQ 486 from the original marine data base were sent to CIRES for inclusion. Dupelim tests were not performed on this file.
1.9 MSQ 105 Post-1928
A similar problem in the Atlas involved the omission of roughly 100,000 reports, which was discovered only in 1983 after COADS dupelim and untrimmed processing was complete. Therefore, no dupelim tests were performed on this file, but MSQ 105 was run or re-run through all but the untrimmed processing steps.
1.10 Monterey Telecommunication
Monterey Telecommunication reports cover the period October 1966 through 1977. They were acquired by NCDC from NOAA/NMFS (National Marine Fisheries Service) in Monterey, California. In transmittal this data set was named "Kunia" ship reports and was sent in a packed binary format. The original tapes reside in NCDC tape library under TD-9769.
Serious problems prevented this data set from being incorporated into the Atlas during the late 1970s. These problems appeared to be confined to the pre-'70s data. Therefore, deck 555 was included in the '70s Decade but excluded from the Atlas.
For the pre-'70s, it was decided to pre-process the Monterey data
set to eliminate erroneous reports and most "hard" dups by using three
conditional checks shown in supp. I. Table K1-2
summarizes tests performed upon several Marsden Squares using these three
conditional checks in order to eliminate erroneous reports. Of all the
Monterey reports eliminated, most had "-0013000" in columns 70-77 (wave
period and height; swell period and height).
                                                  Reports
                         Total number of      eliminated based
MSQ    Total reports   reports eliminated   upon positions 70-77
----------------------------------------------------------------
 30       2,765              1,061                 1,010
300         969                278                   266
310         965                367                   361
356         473                 95                    89
----------------------------------------------------------------
These data were acquired by NCDC from the National Oceanographic Data Center around 1978, and consist of reports from three different types of vessels. XBT (Expendable Bathythermograph) and MBT (Mechanical Bathythermograph) reports contain only temperature measurements (primarily sea temperature). The SD (Station Data) reports are usually more complete meteorological reports, taken aboard oceanographic survey ships. The data acquired in 1978 contained all historical reports available at the time. Recent data have been received by NCDC from NODC on an annual basis.
1.12 Ocean Station Vessels, and Supplement
Ocean Station Vessels (OSV) were ships that reported weather conditions at more or less fixed positions at sea. A ship was considered "on station" when it was on duty within about a 210-nautical-mile square centered at its assigned position. Otherwise it was considered "off station." NCDC archives OSV data for "on station" only and "on and off station" combined. Combined data were included in this project. The individual stations are A, B, C, D, E, H, I, J, K, M, N, P, and V. Additional stations Q, S, T, U, and X were included in the supplement.
1.13 Ocean Station Vessel Z
Ocean Station Vessel Z was acquired from South Africa by NCDC. The OSV was operated by South Africa off the Cape of Good Hope and was unofficially named "Z" by NCDC. Data cover the period 1971-1974.
1.14 Old TDF-11 Supplements B and C
These supplemental TD-11 files contain data collected by NCDC after the original marine data base was created (c. 1968), consisting of historical and then-current marine reports. The exact history of these two files is rather obscure, but it is known that data from some supplemental files were merged and a new supplemental file started as part of an occasional update. Available supplemental files were included in the Atlas when the Atlas tapes were created.
1.15 South African Whaling
In 1967, NCAR acquired from South Africa more than 100,000 punched cards in an unknown format for the region south of 50°S. Many cards had been destroyed by rodents in South Africa. The cards from the original 1967 receipt now reside at NCAR.
This data set was especially troublesome because the format was not known. Several inquiries by NCAR to South Africa did not resolve the format question. In October 1982 it was decided to try and decipher as much of the format as possible.
CIRES sent a converted tape in November 1982 to NCDC, changing all illegal overpunches and characters to blanks. NCDC tried to decipher the format on the basis of experience gained with other historical formats, and succeeded in deciphering about 40%. Through CIRES testing of the output, another 20% of the format was deciphered, including the important discovery that columns 44-45 contained an indicator for supplemental data fields in columns 46-80.
Since most of the format was now known, it was decided to convert all data to TD-11 and perform dupelim tests with other data sets. When dups were found, the South African report was checked against the matching report to determine if fields were correctly assigned. From the dups that were found, the South African format was completely deciphered except for some of the supplemental data fields.
The computer program that converted South African Whaling data to TD-11 was written at NCDC. All fields before column 44 were transferred to TD-11. Columns 44-45 and columns 46-80 were an indicator and supplemental data fields, respectively. These fields were moved as one long character string into TD-11. This was done because time would not permit the extensive programming required for a field-by-field transfer and because many of the supplemental data fields would not fit in TD-11.
In order to fit into TD-11, several fields had to be computed or converted. MSQ and 1° MSQ were computed, and octant was converted to quadrant. Air, sea surface, and dew point temperatures were converted from whole degrees Fahrenheit to tenths of a degree Celsius. Wet bulb temperature was computed when air and dew point temperatures were both present. Since the leading digit(s) of the pressure field was truncated, the following procedure was used: 1) if pressure was less than or equal to 599, then 10,000 was added to the field; 2) if pressure was greater than 599, then 9,000 was added to the field.
Several problems found in the hour field forced many reports to
be deleted entirely. These problems involved different time-reporting
practices, resulting in hour values outside the range 00 through 23.
Fortunately, the reporting procedures were associated with an
indicator in columns 44-45. The indicator also matched specific decks
in the Atlas. The correct hour in GMT could therefore be deciphered
by performing dupelim tests (see Table K1-3).
   Indicator
(columns 44-45)    Matching Atlas deck     Hour problem
-------------------------------------------------------------
       1                  188           many hours equal 99
      11                  192          hour between 50 and 73
       3                  194               field blank
      33                  194               field blank
    00-23               unknown             field blank
-------------------------------------------------------------
Procedures 2) and 4) deleted 35,187 reports from the South African data set. Results of dupelim testing indicated that these reports were already in the Atlas file. Therefore, this large number of deletions had little if any effect on the final data base.
1.16 '70s Decade
Similar to the COADS project, the NCDC '70s Decade (1970-1979) project brought together several marine data files, uniformly edited and merged into a single file. The resulting data base (TD-1127, later converted at CIRES to TD-1129) was of higher quality and provided more economical service to surface marine data users. Additional information on this data base is available in [6].
1.17 '70s Decade Mislocated Data
During conversion of the '70s Decade from TD-1127 to TD-1129, performed at CIRES, reports with erroneous or inconsistent time/space location fields were discarded to a separate file. However, conversion from TD-1129 to LMR permitted the Marsden Square number to be inconsistent with latitude, longitude, and quadrant under certain circumstances (supp. I) and qualifying reports were accepted.
2. Hard Duplicate Elimination Test Procedures
Hard dupelim procedures were run individually on nearly every TD-11 data set against the Atlas. For example, tests were performed on Atlas versus HSST, Atlas versus IMMPC, etc. Initially, the following checks were made to determine dups: 1) location was tested to whole degrees latitude and longitude, instead of tenths of a degree; 2) date was checked to be within 1 day; 3) hour was allowed to vary by 1; and 4) seven individual weather elements were checked for equality. These elements were wind speed, visibility, present weather, past weather, sea level pressure, air temperature, and sea surface temperature. For reports to be considered dups, three parameters could be unequal if seven common elements were present. Two parameters could be unequal if five or six common elements were present. One parameter could be unequal if three or four common elements were present. There could be no parameters unequal if only one or two common elements were present.
If any of conditions 1) through 4) were not met, the two reports were considered unique with respect to each other. When all the conditions were met, the two reports were considered dups and written to a separate file. To ensure that dupelim was finding "good" dups, a check-dup program was then run on the dup output file. This program made counts of exact matches and those that had some type of data problem (matches inexact). Unique data problems found by the check-dup program were then written to a separate file for visual inspection. From this visual inspection, the final dupelim plan was fine-tuned to handle the data problems effectively.
Several additional dupelim programs were also developed for finding other unique data problems missed by this procedure. These programs involved varying the stringency of the four main checks just described. One program had a less stringent check on location. Another program had no check on hour, whereas another allowed year, month, day, and hour to vary by one. In addition, the number of unequal weather elements allowed for duplication was varied. These additional dupelim programs found several data problems missed by the main plan.
Sample results of hard dupelim testing (Table K2-1a) compare the HSST data set with the Atlas file, in terms of the overall percentage of HSST reports that matched the Atlas, and the percentage of those matching HSST reports with some type of data problem. MSQs* and time periods were carefully chosen to provide a representative sample of each TD-11 data set. Tables K2-1b and K2-1c show these results separately for different Atlas decks. Similar tables were constructed for other TD-11 data sets discussed in secs. 2.1 through 2.18.
_____________________
* All dupelim testing at NCDC and its initial specifications used
Marsden Squares, but the final implementation (see secs. 5-7) actually
used the "10° box" system (supp. G).
_____________________
2.1 Result of Dupelim Testing: Atlas vs. Atlas
When the Atlas was created in the 1970s, an error was found in the computer program that identified dups. This error happened only when dups and non-dups all had the same location and time fields. Under these conditions when dups were interspersed with non-dups, some reports that were actually dups found their way into the final Atlas data base. Because this error affected only the North Atlantic basin, it was decided to perform extensive dupelim tests on that portion of the Atlas file. Other ocean basins besides the North Atlantic were also tested to determine the effectiveness of the dupelim plan that created the Atlas.
A modified hard dupelim program was run on the Atlas file. All Atlas reports from a test square were kept in the same file and compared with each other. Fourteen MSQs were tested, totaling 173,858 reports. Of this total only 710 (or 0.4 percent) were dups. A few interesting differences were found between the dupelim plan developed for this project and that used for the Atlas.
The main difference is that the current dupelim procedures test
latitude and longitude only to whole degrees, whereas old procedures
tested to tenths of a degree. When this less stringent check on
location is used, Atlas deck 188 seems to be a complete duplication of
deck 192. The old procedures failed to discover this because deck 188
had location originally keyed to tenths of a degree, while deck 192
was keyed only to whole degrees. A similar discrepancy was found
between matches of decks 194 and 197.
                                                 Report Count    Percent
                                               ----------------  of HSST   Percent
 #  Area                       MSQ     Period   Atlas     HSST   matchesa  inexactb
-----------------------------------------------------------------------------------
 1                         132,429      -1879   10,022    8,424    86.9      22.1
 2                     121,124,429  1880-1909   13,339   16,440    75.9      14.8
 3  Pacific  25,46,129,197,429,121  1910-1939   59,610   30,309    64.8      10.3
 4                        22,84,90  1940-1960   38,470    4,761    64.6       0.5
 5                       all above      -1960  121,441   59,934    70.9      13.0
-----------------------------------------------------------------------------------
 6                     148,339,479      -1879   47,100   30,886    98.8       5.9
 7                     114,300,410  1880-1909   33,012   96,537    32.0      36.4
 8  Atlantic      5,76,217,449,520  1910-1939   65,755   70,214    75.0      35.4
 9                      38,220,406  1940-1960   54,579  139,547    36.2      18.8
10                       all above      -1960  200,446  337,184    48.8      25.0
-----------------------------------------------------------------------------------
11                         363,474      -1879   34,682   23,663    97.6      81.8
12                      30,397,441  1880-1909   60,777   79,012    72.9      39.7
13  Indian     179,367,436,470,513  1910-1939   63,887   67,638    81.4      61.3
14                      27,440,543  1940-1960   42,947   45,148    54.1      20.7
15                       all above      -1960  202,293  215,461    74.3      50.3
-----------------------------------------------------------------------------------

a Percentage of HSST reports, out of the total count, that matched the Atlas.
b Percentage of HSST reports, out of the number matching the Atlas, that had at
least one type of data problem causing them not to match exactly.
_________________
       Deck 116      Deck 118      Deck 184      Deck 189
       --------      --------      --------      --------
#a      %Mb   %Ib     %M    %I      %M    %I      %M    %I
----------------------------------------------------------
 1
 2
 3                                               0.1  18.2
 4     2.3                                      19.2
 5     0.2                                       1.6   0.6
----------------------------------------------------------
 6
 7
 8                   0.9
 9    0.03   0.0c    0.07          7.7   0.0c    1.2  68.9
10    0.01   0.0c    0.2           3.2   0.0c    0.5  68.9
----------------------------------------------------------
11
12
13    0.09           2.6                         0.1  19.0
14    0.3           10.0           5.0          23.6  46.8
15    0.09           2.9           1.1           5.0  46.6
----------------------------------------------------------

a Numbers identify areas and time periods as labeled in
Table K2-1a.
b Percentage of HSST matches (%M) or percentage inexact (%I)
as given in Table K2-1a, but for the indicated decks, only.
c A very small number, as opposed to blank meaning exactly 0.
_____________________
       Deck 192       Deck 193       Deck 194     Other decks
       --------       --------       --------       --------
#      %M    %I       %M    %I       %M    %Ia      %M    %I
-------------------------------------------------------------
 1    14.1   3.7                    72.8  25.7
 2    23.3   6.7                    52.7  18.3
 3    36.2   5.2                    28.4  16.9
 4                                  43.1   0.8
 5    26.7   5.4                    42.5  18.2
-------------------------------------------------------------
 6     6.7  42.6b    91.6   3.1      0.6  15.6
 7    23.2  45.0b     4.6   1.0      4.2  28.2
 8    44.8  46.6b    21.9  20.5      7.5  16.1      0.05  2.6
 9                                  15.1   0.6     12.1  48.6
10    16.6  45.8b    14.3   8.5      9.1   7.0      5.0  48.5
-------------------------------------------------------------
11     3.0  31.5b    84.6  90.0      9.9  27.0
12    20.9  35.9b    51.5  41.5      0.6  15.9
13    24.4  32.3     41.7  95.8     12.5  16.6
14                                  15.2   0.8      0.02 90.0
15    15.6  34.1b    41.2  69.6      8.4  11.9     0.005 90.0
-------------------------------------------------------------

a The percentage does not reflect data problems associated with
location coordinates (tenths of degree latitude and longitude).
b More than one data problem in each report.
_____________________
The extent of dups in the North Atlantic basin turned out to be insignificant. Of the four MSQs tested (114, 148, 217, and 220), only 11 dups were found. The programming error in the dupelim plan that created the Atlas apparently had little effect on the resulting data base.
2.2 Results of Dupelim Testing: Australian vs. Atlas
A total of 21,659 reports from six MSQs was selected from the Australian data set (about 10%) and compared against the Atlas. Dups were found only during 1960-1969. In every case the duplicate Australian report matched deck 128 in the Atlas.
Two data problems were found. The first problem involved several dups that were exact matches except for days off by 1. These reports were obvious dups since all weather elements (six out of six) matched exactly. The second problem involved present weather equal only to the tens digit. For example, the Atlas report would have present weather coded 51 while the Australian report would have 53. This type of difference, caused by the Atlas quality control, occurred 59 times in the test run and required special treatment.
2.3 Results of Dupelim Testing: HSST vs. Atlas Deck 116
Unexpected duplication was found between HSST data and deck 116. A small number of dups were found in several MSQs in all three ocean basins (see Table K2-1b). It was not possible to identify the HSST data source in the Atlantic and Indian basins. However, in the Pacific where data source was available, deck 116 matched HSST decks 150 (Dutch) and 152 (English).
The HSST-deck 116 dups in the Atlantic are explained in [5]. For some reason, OSV reports (about 15,000) for stations "India" and "Julliette" (which were a part of original deck 194) were reproduced years ago and placed in deck 116. This means that some reports in deck 116 are not Merchant Marine but OSV and originated from deck 194.
The reason for the HSST deck 116 matches in the Indian and Pacific basins is more speculative. Apparently, many years ago, the United States exchanged data with the Dutch and English. They seem to have lost track of the source and sent it back to us as HSST data. This presents no problem to this project since dupelim is largely independent of data source. However, it could mean that HSST sea surface temperatures are not strictly bucket observations (deck 116 contains intake temperatures) as was previously assumed during the HSST project.
A data problem also exists in Atlas deck 116 and probably HSST data. All air and sea surface temperatures were supposed to be coded in Fahrenheit, although a few ships coded one or both of these parameters in Celsius. In conversion of deck 116 to TD-11, all temperatures were changed from Fahrenheit to Celsius, resulting in a double conversion for some observations. Temperatures being converted from Celsius to Celsius were eliminated in Atlas deck 116 only when they fell outside acceptable quality control limits for a given area. Since there is no way of identifying which reports have this problem, the same approach was taken for the HSST data set.
2.4 Results of Dupelim Testing: HSST vs. Atlas Deck 118
Exact dups were found between deck 118 and HSST data in both the Atlantic and Indian basins. However, no matches were found in the Pacific (see Table K2-1b). No data problems were discovered that required special procedures. However, it was found that both air and sea surface temperatures were reported only to whole degrees Celsius. This is verified in [5].
2.5 Results of Dupelim Testing: HSST vs. Atlas Deck 184
In the Atlantic and Indian basins, HSST-deck 184 matches were found in all six MSQs tested for the 1940-1960 period (Table K2-1b). No matches were found in the Pacific basin.
A Beaufort wind problem was found in the Atlantic basin. A small percentage of reports in the HSST file had wind speeds converted directly to knots from meters per second, as opposed to being bracketed at the arbitrary midpoint for the Beaufort wind force. To correct this error within the dupelim plan, the affected HSST wind speeds were reconverted from the original values in meters per second that were saved in the supplemental data fields.
2.6 Results of Dupelim Testing: HSST vs. Atlas Deck 189
All three ocean basins had HSST-deck 189 matches. In the Indian basin, these dups represented the largest percentage of total matches for the 1940-1960 period (Table K2-1b).
Two data problems were found. In the Pacific and Indian Ocean basins, a very small number of HSST reports had exact dups with deck 189 when the day was off by 1. This could be similar to the problem in Atlas deck 194 (sec. 2.9) since hour was converted from watch number for some reports. The source of this error (deck 189 or HSST) could not be determined since the original records were not available at NCDC.
The second data problem involved the Beaufort wind scale and required special dupelim procedures. In the Atlas, wind speeds in deck 189 required no conversion since they were recorded directly in knots. However, the HSST format required all wind speeds to be in meters per second. These HSST wind speeds should have been reconverted directly back to knots when they were put in TD-11 format. Instead, they were bracketed at the midpoint for the appropriate Beaufort wind force. This problem affects about half of the HSST-deck 189 matches and was found only in the Atlantic and Indian basins. Special allowances were made in the dupelim plan to reconvert HSST wind speeds directly to knots when a report matched deck 189 in date, time, and location.
2.7 Results of Dupelim Testing: HSST vs. Atlas Deck 192
HSST-deck 192 matches were found in all three ocean basins, and represented the largest source of dups in the Atlantic and second largest in both the Pacific and Indian Oceans. Several data problems exist, affecting 5.4% of the total matches in the Pacific, more than 45.8% in the Atlantic, and more than 34.1% in the Indian Ocean (Table K2-1c). Exact percentages could not be calculated easily for the Atlantic and Indian basins because more than one data problem was often found in a single report.
Two errors occurred in all three ocean basins. Sea level pressure in the HSST file was found to be consistently off by a tenth of a millibar or recorded to whole millibars when a report matched Atlas deck 192. To eliminate all dups, sea level pressure was tested only to whole millibars for deck 192.
The second problem involves hour. In conversion from local time to GMT, slightly different time zones were used for the HSST file and Atlas deck 192. This resulted in the hours differing by 1 in longitude bands near the 24 time zones across the world. This problem was eliminated in the Pacific basin in a past project by comparing HSST deck 151 (HSST data source identifiable in Pacific) with deck 192. When time was within 1 hour, the reports were considered dups and deck 192 was retained over the HSST.
In the Indian and Atlantic basins, where this error was not previously corrected, a large number of HSST-deck 192 dups were found to have the hour problem. In addition, when the hour crossed into the next day, dups were found that had days off by 1 and hours at 00 or 23 GMT. It follows that on the last hour of an arbitrary month and/or year, dups may occur in which the years are off by 1, months are off by 1 or 11, days are off by 30, 29, 28, or 27, and hours are either 00 or 23 GMT. No attempt was made in the current dupelim plan to find dups when hour crossed into the next month and/or year. Therefore, some HSST reports that are actually dups were considered unique. Their number is expected to be extremely small and should have little effect on the final data base.
In addition to the errors described in all ocean basins, a major Beaufort wind scale problem was found in the Atlantic basin. All estimated HSST wind speeds were supposedly sent to NCDC in meters per second according to the "new" Beaufort scale. Conversion programs at NCDC assumed this and changed wind speeds to knots by bracketing at the midpoint of the "new" Beaufort scale. However, the Germans appear to have erroneously sent the wind speeds according to the "old" Beaufort scale. Therefore, some wind speeds (at midpoints 2, 5, 13, 44, 52, and 60 knots) in the HSST file were assigned the wrong speed and never match Atlas deck 192. This affects 40% - 50% of the HSST-deck 192 dups. To correct this conversion error, special allowances were made in the dupelim plan to reconvert HSST wind speeds using the "old" Beaufort scale when reports matched deck 192 in date, time, and location.
2.8 Results of Dupelim Testing: HSST vs. Atlas Deck 193
Dups between deck 193 and HSST data occurred in both the Atlantic and Indian basins. However, no matches were found in the Pacific because Dutch data were received only for the years after 1938 (Table K2-1c). Several major data errors were found.
Hour was frequently off by 1 when HSST-deck 193 dups were found. This error is probably similar to that described in sec. 2.7 for Atlas deck 192. Apparently, slightly different time zones were used when converting from local time to GMT. The same pitfalls described for deck 192 apply to HSST-deck 193 dups.
The second error concerns location coordinates. In the original reports, location was recorded only to the nearest 1° MSQ. When the report was converted to TD-11, tenths of degree latitude and longitude were arbitrarily placed at the corner of the 1° MSQ in the Atlas file (location coordinates were given a tenths digit of 0); whereas the HSST location was assigned a tenths digit of 4 in the Atlantic, and a tenths digit of 5 in the Indian. Since dupelim procedures are based upon whole degrees, no modification of the plan was required.
The third error involved sea level pressure. This parameter was rarely found in the Atlas data set but was almost always available in a matching HSST report. Reference manuals indicate that sea level pressure was corrected for temperature and reduced to mean sea level but was never corrected for gravity. For this reason sea level pressure was excluded from the Atlas file for deck 193. HSST reports with sea level pressure were probably also never corrected for gravity, but were keypunched anyway.
The fourth error is much more serious and required special dupelim procedures. Air or sea surface temperatures in the HSST file were occasionally found to have the tens, units, or tenths digits truncated to 0 or blank. For example, if sea surface temperature in a deck 193 Atlas report were 28.5°C, the corresponding value in the duplicate HSST report could be 28.5, 8.5, 20.5, or 28.0. This air or sea surface temperature error was found in about 1% of the HSST-deck 193 dups and was never found to affect more than one digit out of a three-digit temperature field. This presented a major problem for the dupelim plan. Since HSST data source is unidentifiable in the Atlantic and Indian basins, a bad HSST temperature is found only when the report matches one in the Atlas file. And if both air and sea surface temperatures have this truncation error within the same report, current dupelim procedures would consider the report unique and introduce erroneous temperatures into the final data base.
To eliminate potential HSST dups having this error, each
temperature field was tested digit by digit. For example, an HSST
report might match a report in Atlas deck 193 in location and time,
but not in air and sea surface temperatures:
Example:           Air temperature    Sea surface temperature
                 --------------------------------------------
          Atlas  |      25.5                   22.1
          HSST   |      20.5                    2.1
In addition to the data problems just described, two other errors were discovered only in the Indian basin. The first error is very serious and required special dupelim procedures for HSST-deck 193 matches. Exact dups were found when there was a 6- or 7-hour difference between Atlas deck 193 and HSST data. This error was found only in octant eight of the Indian Ocean and, in most cases, affects nearly all of the HSST-deck 193 matches (Table K2-1c). It is assumed that the error source is Dutch-processed HSST since this problem was not found in German-processed HSST data of octant eight in the Atlantic basin. The original records would have to be checked to confirm this assumption.
The key to the 6- or 7-hour difference could be the fact that the error occurs only in octant eight. Since the world is divided into four octants north of the equator and four south, the time difference is 6 hours between octants. Apparently, a computer program that converted the original reports placed the time in the wrong but neighboring octant. This would make the hour off by 6. Since the location of the duplicate Atlas and HSST reports is the same, it is assumed the programming error occurred only in time and not location (i.e., the reports are in the right place but have the wrong time). The 7-hour difference is probably a combination of the 6-hour error and the time zone error.
The second problem in this ocean basin involves day but affects only a very small number of reports. Exact dups were found when Atlas deck 193 had day 31, while HSST had day 30. This occurred only when the next month had 30 days (i.e., the error was found only in March, May, August, and October). Apparently, a computer program (probably the Dutch) incorrectly assigned to these months only 30 days. No modification of the dupelim plan was necessary since it tolerates differences of 1 day.
Several assumptions have been made in order to explain these data problems. To verify these assumptions, additional research is needed, possibly involving some type of track checking, as well as going back to the original Dutch records. Whether the HSST or Atlas data sets are at fault is unknown at this time.
2.9 Results of Dupelim Testing: HSST vs. Atlas Deck 194
HSST-deck 194 matches were found in all three ocean basins. In the Pacific, these matches represented more than 40% of all the HSST reports tested for that basin. The Atlantic and Indian Oceans also had significant percentages (Table K2-1c). Several data errors have been identified.
The first error concerns date. In the early years, ship reports were made according to watch number, which corresponded to a particular hour. On the midnight watch (number six) of an arbitrary day, Atlas deck 194 reported hour 00 local time of the next day. When the hour was converted to GMT, an error placed the report in the wrong (previous) day. The percentage of inexact matches in Table K2-1c indicates that this type of error was rarely found in the later years (1940-1960) but represented 15%-28% of the early-year matches (before 1940). Apparently, sometime around 1940, reports in deck 194 were no longer taken according to watch number but recorded directly in hours.
Dupelim procedures were designed to handle this day crossing problem only within a month. No attempt was made to find HSST dups that crossed into the next month or year. Testing was done in the Pacific basin to determine the magnitude of this crossing month and year problem. Several areas were tested and revealed only about a 0.4% error. This means that about 0.4% of the HSST reports from this particular data source would be considered unique, when they are actually dups.
The second error concerns location coordinates. This error is identical to that described in sec. 2.8 for Atlas deck 193. In the original reports, location was recorded only to the nearest 1° MSQ.
The third error was found in the Atlantic basin only and involved Beaufort wind speeds. A small number of HSST reports had wind speeds converted from meters per second directly to knots. When matched with Atlas deck 194, it was found that these Atlas wind speeds were bracketed to the appropriate Beaufort midpoint. To correct this error within dupelim, the affected HSST wind speeds were bracketed using the original values in meters per second that were saved in the supplemental data fields.
The final error concerns wind speed. All calm wind speeds are missing in Atlas deck 194 but are available in the HSST data set. Apparently, the computer program that converted deck 194 to TD-11 interpreted calm wind speeds as missing values. These calm values were inserted into Atlas deck 194 when a match was found with HSST data.
2.10 Results of Dupelim Testing: HSST vs. Other Atlas Decks
Dups with HSST data were found in six other Atlas decks: 128, 188, 196, 197, 891, and 902. Deck 188 matches were found in both the Atlantic and the Indian basins. Otherwise, these decks had HSST dups only in the Atlantic (Table K2-1c).
Beaufort wind scale problems were found between HSST data and Atlas decks 128, 188, 196, and 902. HSST data were converted directly to knots in some cases, indicating that wind speeds were measured. The Atlas decks were bracketed at the appropriate midpoints according to the Beaufort force. HSST data were reconverted within dupelim and then bracketed using wind speed in the supplemental field. This solved the dupelim problem but does not determine whether HSST or Atlas data are in error. In MSQ 220, this error source is significant. Deck 128 matched HSST reports 16,702 times. Of these dups, about 48% had Beaufort wind conversion problems.
Other minor problems were discovered. An hour of 99 was found in several HSST reports that matched Atlas deck 188, indicating a missing value. Another error in hour was uncovered in HSST-deck 891 dups. An hour of 24 was found in the HSST file when it should have been hour 00 of the next day. This is a fairly common problem for this data source and has also been found in the NODC data set. For consistency, any hour 24 was converted to hour 00 of the next day.
2.11 Results of Dupelim Testing: IMMPC vs. Atlas
Six MSQs were chosen for dupelim testing with the Atlas. IMMPC reports matched only Atlas decks 116 and 128. A few minor data problems were found.
As a result of Atlas QC, present weather was equal only to the tens digit for a few IMMPC reports when matched with deck 128. Also, some deck 116 dups had wind speed differences of a few knots. Occasionally temperatures were slightly different when a report matched Atlas deck 116.
2.12 Results of Dupelim Testing: Japanese vs. Atlas
Several MSQs were chosen for dupelim testing with the Atlas. Dups were found with Atlas decks 119, 128, and 187. A few minor data problems were uncovered in decks 119 and 187.
When Japanese data matched deck 119, air and/or sea temperatures differed occasionally by a few tenths. Atlas deck 119 appears to have temperatures only to whole degrees, while the Japanese data have values to tenths. In addition, for matches with decks 119 and 187, present weather was sometimes equal only to the tens digit. These two minor errors required special allowances.
The last discrepancy involved a few day or hour crossings between dups. This did not require special treatment because it was within the tolerance of the dupelim plan.
2.13 Results of Dupelim Testing: Monterey Telecom. vs. Atlas
Two MSQs were chosen to test for dups. About 20%-30% of the Monterey reports were duplicate with the Atlas. However, almost all these dups had one or two minor data problems.
The first problem involved slightly different air and/or sea surface temperatures between dups. In addition, sea level pressures were usually found to be different by a few tenths of millibar. When one or both of these problems occurred, the rest of the report was almost always identical with the Atlas report. Therefore, to eliminate dups, special procedures were required for sea level pressure and temperatures in deck 555.
2.14 Results of Dupelim Testing: NODC vs. Atlas
Ten MSQs were chosen for dupelim testing with the Atlas. Of this total, 4 MSQs had reports that were almost entirely duplicate with the Atlas, and 6 were almost entirely unique. Closer examination of test square locations and NCDC's Atlas inventories revealed that the dups were confined to the South Atlantic and South Pacific. Apparently NODC data had not been merged into any other basin.
A few data problems were found. Hour in deck 891 was occasionally keyed as 24 instead of 00 and the next day. In addition, a few reports in Atlas deck 194, 195, and 891 matched NODC data except for an hour difference of 1.
2.15 Results of Dupelim Testing: OSV vs. Atlas
Two OSVs were chosen for dupelim testing with the Atlas. Station A (MSQ 220) was in the North Atlantic and station P (MSQ 195) was in the North Pacific. The duplicate OSV reports found were primarily assigned to OSV deck 116 but matched Atlas reports in both decks 116 and 128. Of all OSV reports, 23.2% were duplicate in MSQ 195 and only 0.3% in MSQ 220.
Two data problems were found. Air and/or sea surface temperatures usually differed by a few tenths when matched with deck 116 in the Atlas or OSV data set. A special check for deck 116 in MSQ 195 indicated that of the total number of matches (7,231), there were 5,479 dups in which either the Atlas or OSV report was assigned to deck 116. Of this number, 4,404 had air temperature equal only to whole degrees, and 4,040 had sea surface temperature equal only to whole degrees. In addition to the temperature problems, a few dups had days differing by 1.
2.16 Results of Dupelim Testing: Old TDF-11 Supplement B vs. Atlas
All reports in this data set were found to be duplicate when compared against the Atlas. However, several data errors were discovered. Occasionally present weather was equal only to the tens digit (the result of Atlas quality control). This occurred in matches with Atlas deck 189 and 128. Air and sea surface temperature matches were frequently different by a few tenths of a degree when deck 116 was involved. A minor wind speed error was found when deck 116 matched deck 189. Fourteen wind speeds were different by one or two knots in reports that otherwise matched exactly. This could be a Beaufort wind scale discrepancy or a mixup of estimated and measured speeds. In addition, erroneous air and sea surface temperatures were found in deck 118 from the Supplement B data set, such as negative temperatures in equatorial MSQ 27. The corresponding Atlas report had missing temperatures (apparently deleted in the Atlas quality control) when matched with these erroneous Supplement B temperatures.
With the exception of those in deck 118, all errors required special treatment in dupelim. The deck 118 temperature problem was identified in QC when the erroneous temperatures were flagged. The origin of these bad values is unknown at this time.
2.17 Results of Dupelim Testing: Old TDF-11 Supplement C vs. Atlas
Dups were found in only one of the three MSQs tested. A total of 20.9% of the reports tested matched the Atlas. Only 1.8% of these dups had some type of data problem.
The most common problem was equality of present weather only to the tens digit. This occurred in matches with decks 116 and 194 and required a special allowance in the dupelim plan. Temperatures were also different by a few tenths when matched with deck 189. However, the occurrence was too infrequent to require special treatment.
2.18 Results of Dupelim Testing: South African Whaling vs. Atlas
Two MSQs were chosen for dupelim testing with the Atlas. Square 520 represented 1910-1939. Dups were found with Atlas decks 188 and 192. Test square 543 covered 1940-1960. Data for this period matched reports in Atlas decks 116, 184, 187, 189, and 194. It appears that the South African Whaling data set is a collection of many historical sources. However, many reports are unique, especially in the later years.
Several errors were found in this data set. More than 85% of all dups were not exact matches. The most common problem was air and/or sea surface temperatures, differing by a few tenths, which occurred with matches of many Atlas decks. This is easily explained. The temperature fields for the South African data were keyed only to whole degrees Fahrenheit; the tenths position was either truncated or rounded. When these temperatures were changed to tenths of a degree Celsius by the NCDC conversion program, an obvious loss of accuracy resulted. This loss of accuracy from converting whole degrees Fahrenheit to Celsius is a possible explanation for other card decks (116, 119, and 555) that have similar temperature problems.
In addition to the temperature problem, sea level pressure was occasionally equal only to whole millibars for matches with Atlas decks 189 and 192. Also, present weather was equal only to the tens digit for matches with Atlas decks 184, 188 and 194. Some wind speeds in Atlas decks 184 and 192 differed by a few knots when matched with the South African data set.
To eliminate dups in this difficult data set, several special procedures were required for deck 899. These involved temperatures, pressure, present weather, and wind speed, and are explained in sec. 4.
3. Easy Duplicate Elimination Test Procedures
Easy dupelim tests were run on all TD-11 data sets (except the Atlas) merged into one file. These tests were performed to identify dups only among TD-11 sources other than the Atlas. The Atlas was excluded because extensive tests using hard procedures had already been performed between the Atlas and all other TD-11 data sets.
Once all data for a particular test MSQ were merged into one file, the reports were sorted by MSQ, 1° MSQ, year, month, day, hour, and sea level pressure. The easy dupelim program tested only for exact matches with date, time, and location (whole degrees only). When these conditions were met, the two reports were considered dups and written to a separate file. Otherwise, the reports were considered unique with respect to each other. Weather parameters were not tested in this first stage of easy dupelim.
To find out if this procedure was too lenient, a check-dup program was run on the dup output file. This program was similar to the one described in sec. 2. Counts were made of exact matches and those that had one or more unequal weather elements. When location and time matched exactly between two reports, tests were performed on four weather elements: wind speed, sea level pressure, air temperature, and sea surface temperature.
Table K3-1a gives overall easy dupelim test results, and Table
K3-1b has details on which source data sets matched. The most frequent
data set match was with the HSST, as was expected because the HSST
data set is a conglomeration of many marine files. Also, there were a
significant number of dups within some data sets.
                            Report   Percentage
#  MSQ         Period        count   of matches
-----------------------------------------------
1   27         1940-1960    58,760      19.2
2   38         1940-1960    71,464      17.0
3  220         1940-1960    95,324      27.8
4  356         1960-1969    14,686       4.8
5  440         1940-1960     9,296      18.1
6  543         1940-1960     3,146       1.6
7  all above   1940-1969   252,676      20.7
-----------------------------------------------
---------------------------------------------------------------------
        Hc      H       H       H       H       H       I       I
#b      Hc      B       I       O       W       A       I       M
---------------------------------------------------------------------
1      0.02   15.9     3.0                     0.01
2      0.05    0.004  16.9                             0.01
3     12.9             0.01   14.9                     0.001
4                      2.3                             1.5     0.01
5      0.7     2.0    15.4
6      0.3                             0.7
7      4.9     3.8     6.2     5.6     0.01    0.003   0.09    0.0004
---------------------------------------------------------------------
        I       I       B       B       B       O       M       W
#       J       W       B       I       A       O       M       W
---------------------------------------------------------------------
1                      0.2     0.02    0.05
2                      0.001   0.004
3                                              0.001
4                      0.4                             0.6
5                              0.01
6      0.1     0.2                                             0.4
7      0.001   0.002   0.06    0.01    0.01    0.0004  0.03    0.01
---------------------------------------------------------------------

a Source data sets are abbreviated as follows:
       A = Australian
       B = Old TDF-11 Supplement B or C
       H = HSST
       I = IMMPC
       J = Japanese
       M = Monterey Telecom.
       N = NODC
       O = OSV
       W = South African Whaling
b Numbers identify areas and time periods as labeled in Table K3-1a.
c Percentage of matches for HSST vs. HSST, etc.
___________________
4. Pre-'70s Duplicate Elimination Specifications
The dupelim plan developed for this project was designed according to specific data problems described earlier. For simplicity in programming, hard and easy dupelim procedures were combined into one general plan. This was possible because easy dupelim procedures were encompassed by hard procedures.
Five main checks are performed to eliminate dups among all data sets: 1) location, 2) date, 3) time, 4) individual weather parameters, and 5) special deck allowances. Checks 1) through 4) are the same for all data sets. Check 5) is more specific and applies only to certain data sources or decks.
4.1 Conditions Applied to All Data Sets
The conditions listed in Table K4-1 are checked in the stated
order to identify possible dups.
                   Value in                                Value in
Type of check    first report       Relationship         second report
----------------------------------------------------------------------
location           10° MSQ           must equal            10° MSQ
date               year              must equal            year
date               month             must equal            month
location           1° MSQ            must equal            1° MSQ
date               day           must be within 1 of       day
time               hour          must be within 1 of       hour
----------------------------------------------------------------------
If 7 common elements are present in both reports, only 2 can be unequal.
If 6, 5, or 4 common elements are present in both reports, only 1 can be unequal.
If 3, 2, 1, or 0 common elements are present in both reports, 0 can be unequal.
Note: In the actual implementation of dupelim, the numbers of common elements listed above were modified according to Table K5-3. This discrepancy was undocumented in the original published edition of COADS Release 1.
When day and/or hour do not match exactly between reports, then the same seven weather elements are checked for equality. The following conditions determine whether reports are unique:
If 7 common elements are present in both reports, only 1 can be unequal.
If 6, 5, 4, 3, or 2 common elements are present in both reports, 0 can be unequal.
If 1 or 0 common elements are present in both reports, consider the reports unique.
4.2 Special Allowances
Some data sources or deck numbers were found to have certain problems that require special treatment within the dupelim plan. Without these special allowances many reports would be considered unique when they were actually dups.
#1 Temperatures off by < 1° (any match with decks 116, 119, 555, or 899).* Test air and sea surface temperature to whole degrees only. If air and/or sea surface temperature are still not equal between two reports, add 0.9 to the lower value, giving A, and test that the other temperature is less than or equal to A.For example, suppose a report matches deck 899 in location and time, but air and sea surface temperature are not equal between reports:
            Air temperature  Sea surface temperature
           -----------------------------------------
any deck  |      24.2                22.8
deck 899  |      24.0                23.4
Each temperature between the two reports is tested to whole degrees. This yields equal air temperature but unequal sea surface temperature. Adding 0.9 to the lower sea temperature gives 23.7. Since 23.4 is less than 23.7 the two sea temperatures are now considered equivalent.#2 Present weather off by units digit (any match with the Atlas). Present weather might not always be equal between two dups. This is true in the Atlas, where present weather was some times changed slightly when run through quality control. For example, two reports could be exactly the same except for a present weather of 60 in one report and 62 in the other. Therefore, to eliminate all dups, present weather is tested only to the tens digit.
#3 Wind ranges used to test for equality (all decks). Wind speed conversion problems exist throughout the marine data base. These discrepancies have occurred because of confusion over the "old" (official WMO) and "new" (only used in the HSST) Beaufort scales, and also because of the change-over from wind speeds estimated to those measured. Therefore, to eliminate dups, ranges of wind speed based on midpoints of the "old" and "new" Beaufort scales and the original ranges of the two scales are used to determine equality (see sec. 5.9). In addition, tests were made with actual data to ensure the validity of this scheme.
#4 Pressure to whole millibars (deck 192 vs. HSST and any location and time match with decks 555 or 899). Pressure is first tested to whole millibars. If pressures are still not equal, then for deck 192 vs. HSST matches one-tenth millibar is added to the HSST value and then another test for equality is made to tenths of a millibar. For location and time matches with deck 555 or deck 899, one-tenth millibar is added to the lower value and then a test for equality is made to whole millibars.
#5 Temperatures lost digits (deck 193 vs. HSST decks other than 192). Air and sea surface temperature problems occur in some HSST reports that match deck 193. If air temperatures are equal between reports and sea temperatures are also equal no further action is needed. When one or both of these temperatures do not match, the values must be tested digit by digit. The temperatures are considered exact when two digits out of three are equal and the unequal digit in the HSST report is zero or blank (signs must also be the same). Otherwise, they are unequal. For example, temperatures 20.3 and 0.3 would be equivalent using this scheme.
#6 A 6- or 7-hour time difference (deck 193 vs. HSST Indian). A 6- or 7-hour difference occurs in almost all HSST-deck 193 matches in octant 8 of the HSST Indian basin. A special hour check is performed when the location, year, and month of the HSST report match that of a report in deck 193. When this type of match occurs and hour is greater than the tolerance in the main dupelim plan (± 1 hour), hour is given a new tolerance of +6 or +7 (hour of deck 193 minus hour of HSST, taking into account day crosses). This tolerance is allowed for all deck 193-HSST matches in the Indian basin regardless of octant.
#7 Wind speed conversion problem (deck 189 vs. HSST Indian and Atlantic). When location, date, and time in deck 189 match a report in the HSST file, wind speeds might not be equal because of a conversion problem. If wind speeds are equal between the two reports, no action is required. But, if the wind speeds are not equal (about half the time), the original value in the supplemental data field of the HSST report must be reconverted from meters per second directly to knots. A test for equality is then performed.
#8 Wind speed old/new Beaufort mix (deck 192 vs. HSST Atlantic). HSST reports that match deck 192 were erroneously sent in the "old" Beaufort scale instead of the "new" scale. HSST reports must, therefore, be reconverted to knots using the "old" scale.
When two reports met the conditions applied to all data sets and, if applicable, any of the special allowances just described, they are considered dups. The "best" dup or the report to be retained is determined by quality code (see supp. J).
________________________
* "Any match" includes matches within a category (e.g., another 116
can match 116 under #1), and "vs." in other allowances means only
between the specified categories.
________________________
5. Pre-'70s Duplicate Elimination Refinements
Refinements to the specifications given in sec. 4 were made in order to define related outputs or data changes, to handle unspecified conditions, or to clarify the exact implementation.
5.1 Inventories
For each 10° box, counts of the following were made:
where
I = input number of reports,
O = output number of reports,
D = number of uncertain dups retained (NCDC file is O minus D).
NOTE: Owing to subsequent reprocessing, the QC flag counts are not accurate. They should be used only as estimates.
These counts were written out for each extant 10° box in a packed binary format described in sec. 7.5. In addition, items 3a) through 3e) were automatically printed out at the completion of each 10° box within every run listing, plus the start and end year-month.*
_____________________
* Extensive checks were performed by NCDC on these run listings, in
order to determine if dupelim was working properly. In addition,
comparisons were made with similar inventories produced for the Atlas
data set and for the earlier TD-1100 data base. (Steurer, P. M., 1983:
Checks and Comparisons of 1983 Inventories for Pre 1970's Surface
Marine Data. Unpublished NCDC technical report, 11 pp.)
_____________________
5.2 Lat/Lon Tenths Positions
The latitude/longitude indicator (XYI) in LMR (see supp. F) for
each deck was set as given in Table K5-1.
Deck   XYI        Deck  XYI
---------------------------
*110    1          555   0
 116    0          666   0
*117    1          849   0
 118    0          850   0
 119    0          876   0
 128    0          877   0
 143    0          878   0
 150    0          879   0
 151    2          880   0
 152    2          881   0
 155    2          882   0
 156    2          888   0
 184    0          889   0
 185    0          891   0
 186    0          897   0
 187    0          898   0
 188    0          899   0
 189    0          900   0
*192    1          901   2
*193    1          902   0
*194    2          926   0
*195    1          927   0
*196    1          928   0
 197    0          999   0
*281    1
---------------------------

* For these decks, the tenths position of longitude and latitude (X,Y)
was adjusted from the corner (0,0) to the center (5,5) of the 1° MSQ.
All these decks were consistently at (0,0) except that decks 192-194
had a number of anomalous values that were printed out for reference
before being changed.  In deck 194 these values were already (5,5).
Deck 194 was later subject to substitution of tenths from HSST, hence
the XYI of 2. (A substitution was made into deck 194 from all matching
HSST reports with a tenths numeral other than 5, in order to save any
tenths of degrees that were available in the HSST.)
____________________
The Atlas was automatically selected over the HSST, for example,
in most cases because it had more weather elements. To select between
dups with equal quality codes, a priority list by source ID (Table K5-2)
was used.
Priority  Description                Source ID
----------------------------------------------
   1      NODC                          11
   2      NODC Supplement               12
   3      Atlas                          1
   4      IMMPC                         17
   5      OSV                            8
   6      OSV Supplement                 9
   7      MSQ 486 Pre-1940              10
   8      Supplement B                   5
   9      Supplement C                   6
  10      HSST Pacific                   2
  11      HSST Atlantic                  4
  12      HSST Indian                    3
  13      Australian                    16
  14      Japanese                      14
  15      Eltanin                       13
  16      S. African                    15
  17      Monterey Telecom.              7
----------------------------------------------
5.4 Bathythermographs
Bathythermographs were tested for dups only among themselves (ship type 7), but without distinction between XBT or MBT.
5.5 Day or Hour Cross
A report was allowed to vary by ± 1 hour and still be considered a dup. The hour cross included a match between hours 23 and 00 of the next day, and a match under allowance #6 (6- or 7-hour difference) as special cases. A report was allowed to vary by ± 1 day and still be considered a dup, but the two hours were required to match exactly.
A missing/erroneous day was automatically considered unique, but dupelim was performed on the "hour" consisting of all missing/erroneous hours in a given 1° MSQ-day, with no cross allowed.
5.6 Certain and Uncertain Dups
Dup certainty depends on three factors: 1) whether a day or hour
cross was involved, 2) whether at least one report was GTS (from the
Global Telecommunication System), 3) the number of common weather
elements in agreement. Table K5-3 defines uncertain (U) and certain
(C) dups in terms of these factors.
------------------------------------------------------------------------------
       |         ≥ 1 GTS*              |             0 GTS             |
-------|-------------------------------|-------------------------------|------
     7 |                               |                               |
     6 |                               |                               |
     5 |                               |                               |
dif  4 |                               |                               | no
     3 |                               |                               | cross
     2 |                               |                               |
     1 | C   U   U                     | U   U   U                     |
     0 | C   C   C   C   C   C   C   C | C   C   C   C   C   C   C   C |
-------|-------------------------------|-------------------------------|------
     7 |                               |                               |
     6 |                               |                               |
     5 |                               |                               |
dif  4 |                               |                               | hour
     3 |                               |                               | cross
     2 |                               |                               |
     1 | C                             | U                             |
     0 | C   C   C   C   C   C         | C   C   C   C   C   C         |
-------|-------------------------------|-------------------------------|------
     7 |                               |                               |
     6 |                               |                               |
     5 |                               |                               |
dif  4 |                               |                               | day
     3 |                               |                               | cross
     2 |                               |                               |
     1 | U                             | U                             |
     0 | U   U   U   U   U   U         | U   U   U   U   U   U         |
-------|-------------------------------|-------------------------------|------
       | 7   6   5   4   3   2   1   0 | 7   6   5   4   3   2   1   0 |
       |           common              |           common              |
------------------------------------------------------------------------------

* Note that for the pre-'70s, GTS comprised two known decks: 555 and 999.
_______________________
The dup status (DS) in LMR (see supp. F) was set according to the code:
0 = unique
1 = best dup
2 = best dup with substitution
3 = worse dup, uncertain with hour cross
4 = worse dup, uncertain with no cross
5 = worse dup, uncertain with day cross
6 = worse dup, certain with hour cross
7 = worse dup, certain with no cross
Reports with a DS of 6 or 7 were never output; i.e., the LMR file contains all reports with DS < 6. The TD-1129(M) file contains all reports with DS < 3. For the purpose of DS = 2, a substitution was any one of those given in sec. 5.8. The dup status, once set for a report, could possibly be changed to a higher value (worse) but not lower.
The dup check (DC) in LMR (see supp. F) is missing for all unique reports (DS = 0) and was set for all other reports that matched at least one other report (DS < 6).
0 = GTS and logbook match with sea level pressure and sea surface temperature match (under allowances).
1 = GTS and logbook match without sea level pressure and sea surface temperature match.
2 = not GTS and logbook match.
The dup check, once set for a report, could possibly be changed to a lower value (better) but not higher.
5.8 Substitution of Parameters Between Dups
Three substitutions were made between dups:
5.9 Wind Allowances
The wind allowances #3, #7, and #8 (sec. 4.2) were written assuming that the NCDC converted TD-11 would be used rather than the Exchange format directly. Therefore, these allowances were handled as follows.
#3 Wind ranges used to test for equality (all decks). The meters-per-second column in Table K5-4 was used.
Table K5-4
Wind Ranges for Equality
  Knots     Meters per second
-----------------------------
 0.0≤1.5        0.0≤0.8
 1.5≤4.5        0.8≤2.3
 4.5≤8.0        2.3≤4.1
 8.0≤12.0       4.1≤6.2
12.0≤16.5       6.2≤8.5
16.5≤21.5       8.5≤11.1
21.5≤27.0      11.1≤13.9
27.0≤33.0      13.9≤17.0
32.0≤39.0      16.5≤20.1
38.0≤46.0      19.6≤23.7
45.0≤53.0      23.2≤27.3
53.0≤63.5      27.3≤32.7
  63.5≤          32.7≤
-----------------------------
End-points are doubly inclusive; e.g., if two wind speeds were 0.8 and 2.3, they were considered equal. This allowance was applied to both estimated and measured wind speeds before July 1963 (exclusive). From July 1963 onward this allowance was applied only if one of the two winds being compared had an indicator showing it was estimated; otherwise the two winds were given a tolerance of 0.6 m s-1 (approximately 1 knot) for equality.Note: In the actual implementation of the above rule from 1963 onward, it was only required that one or the other report had an indicator showing that it was other than measured (i.e., estimated or missing indicator value). This discrepancy was undocumented in the original published edition of COADS Release 1.
# 7 Wind speed conversion problem (deck 189 vs. HSST Indian and Atlantic). This allowance was no longer applicable since wind speeds in both the regular and supplemental sections of LMR were in meters per second and identical before bracketing.
# 8 Wind speed old/new Beaufort mix (deck 192 vs. HSST Atlantic). This was handled by applying these rules for bracketing all estimated winds in both the HSST Indian and Atlantic, and without any requirement for a match with deck 192:*
a) If wind was at a "new" midpoint then it was put at the corresponding "old" midpoint.Tests run on the HSST Atlantic tapes picked out what "new" midpoints were usually used. Tests run on the HSST Indian tapes showed only "old" midpoints used. All the "old" values and the remaining anomalous values were subject to b). The midpoints and the ranges used are given by Table K5-5.b) Otherwise it was checked using the "old" ranges and put at the appropriate "old" midpoint.
___________________
* Inadvertently, bracketing never occurred during dupelim
processing, with largely unknown effects on the selection of dups. The problem
goes back when data were converted from the Exchange format to LMR.
The Exchange format had indicators for speed and direction (the point
compass) and speed (whether the wind speed was estimated or unknown,
or measured). Wind indicators showing the wind speed as estimated or
unknown were conservatively interpreted as meaning unknown, and set to
missing in LMR, but the direction indicator was set correctly.
Bracketing was eventually done during conversion from LMR to CMR
(supp. E), according to the method of allowance #8,
and modified wind data were put through QC again in order to regenerate wind
flags.
___________________
Beaufort   "Old"      "New"      "Old"
number    midpoint   midpoint    range*
           (m s-1)    (m s-1)    (m s-1)
-----------------------------------------
 0          0.0        0.8         0≤0.2
 1          1.0        2.0       0.3≤1.5
 2          2.6        3.6       1.6≤3.3
 3          4.6        5.6       3.4≤5.4
 4          6.7        7.9       5.5≤7.9
 5          9.3       10.2       8.0≤10.7
 6         12.3       12.6      10.8≤13.8
 7         15.4       15.1      13.9≤17.1
 8         19.0       17.8      17.2≤20.7
 9         22.6       20.8      20.8≤24.4
10         26.8       24.2      24.5≤28.4
11         30.9       28.0      28.5≤32.6
12         35.0       32.2        32.7≤
-----------------------------------------

* Ranges were taken from [12].
_______________
The following allowances were added (see secs. 4.2 and 5.9 for information on allowances #1 through #8):
#9 Automatic retention of deck 193 (deck 193 vs. HSST Indian and Atlantic). Without this allowance the HSST dups would usually have been retained because pressure was deleted from deck 193. However, the pressures in the HSST were not corrected for gravity, so deck 193 is preferred (especially since it kept the pressure in the supplemental).#10 Automatic retention of deck 192 (deck 192 vs. HSST decks other than 192). Without this allowance the HSST dups would usually have been retained because they may contain total cloudiness, and wet bulb and dew point temperatures. However, the wet bulb and dew point temperatures were computed from relative humidity (available in 192 supplemental), and the total cloudiness was substituted into deck 192, so deck 192 is preferred.
5.11 1° Landlocked File and 5° Limits for QC
Tapes supplied by NCDC were used. Unfortunately, a set of revised limits planned for use was on a 4° latitude x 5° longitude grid; furthermore it was not finished. Lack of time made it impossible to change the existing limits.
6. '70s Duplicate Elimination
The same program as that used for pre-'70s data (sec. 5) was used, except for changes as follows.
6.1 Priority List
Because of the different source ID makeup, a new priority list
was needed, this time by deck (Table K6-1).
Priority  Name                 Deck
-----------------------------------
1         IMMPC             926,927
2         NODC                  891
3         non-GTS other         mix
4         non-555 GTS           mix
5         Monterey Telecom.     555
-----------------------------------
6.2 Day or Hour Cross
Treatment as for the pre-'70s data, except that allowance #6 was no longer in force and no day cross was permitted.
6.3 Certain and Uncertain Dups
Treatment as for the pre-'70s data, except that GTS comprised eight known decks: 555, 666, 849, 850, 888, 889, 999. Decks 849-850, FGGE data, were considered GTS although they may have been mixed.
6.4 Substitution of Parameters Between Dups
None was made.
6.5 Wind Allowance
Only allowance #3 remained in effect, since no HSST data were included.
6.6 Other Allowance
Only #1 remained in effect, its scope broadened to include deck 888, thus:
# 1 Temperatures off by < 1° (any match with decks 116, 119, 555, 888 or 899).
6.7 QC Subroutine
The '70s Decade (SID 18) and some other sources have already been QC'd by NCDC, but the new QC was applied to all data in order to provide consistent criteria for dup selection. The old flags are available in the supplemental and the new flags in the QC attachment of LMR.
7. Dupelim Production Program
The duplicate elimination program (dupelim) was written according to the specifications in secs. 4-6. The following is a description of how the program performs the tasks of locating and eliminating dups. Although the QC subroutine is an important part of dupelim, it is described separately in supp. J.
The program was written in an extended version of the FORTRAN 77 programming language (CRAY-1 FORTRAN) used on the CRAY-1 computer at NCAR. Figure K7-1 is an abbreviated diagram to give the reader a better understanding of how the program processes the data.
Figure K7-1. Duplicate elimination program flow and subroutine names.
7.1 Initializing for a Box
One or more consecutive 10° boxes can be processed during a run of the program. At the beginning of each box all arrays and variables used for summing (of monthly and yearly inventories, etc.) are set to zero, the landlocked and limits data for the QC subroutine are read and stored, and pointers are set so the first report will be input into the first index location of the storage buffer (a two-dimensional array).
Input is in the form of Long Marine Reports (LMR) as described in supp. F. After the first report is unpacked, the checksum is recomputed and compared with the stored checksum. The checksum is computed only for the first report in each box, as a time-saving measure.
7.2 Storage and Flow
The dupelim specifications require that data for two consecutive days be compared, to allow for a day cross between dups (within the same year, month, and 1° MSQ). To keep track of each day of data in storage and to avoid having to move reports around once they are input and unpacked, the data are input to the buffer into consecutive array locations, and pointers set to indicate the beginning and ending locations of both days of data.
After the first report for a box is input, data are read until a new year, month, 1° MSQ, or day is encountered. As the data are input, the variables required for dupelim and QC are unpacked and stored in one-dimensional arrays (one array for each variable, dimensioned the same length as the buffer) at the same index location as the packed report in the buffer.
After a report is unpacked, its lat/lon indicator is assigned, the report moved to the center of its 1° MSQ for specified card decks, its 1° MSQ number computed, and the implied bucket indicator set for HSST data with missing bucket indicators and extant sea surface temperatures.
First, dupelim is performed internal to day1; day2 is then read and positioned in the buffer directly following day1. Second, dupelim is performed across day1 and day2, and third, internal to day2. At this point day1 can be output, freeing up the buffer space that it occupied.
Successive days of data will be read, processed, and output until, when the buffer is full, reports are read into the top of the buffer again, provided that space is no longer being used. Figures K7-2 through K7-4 describe a sequence of this "circular buffer" process.
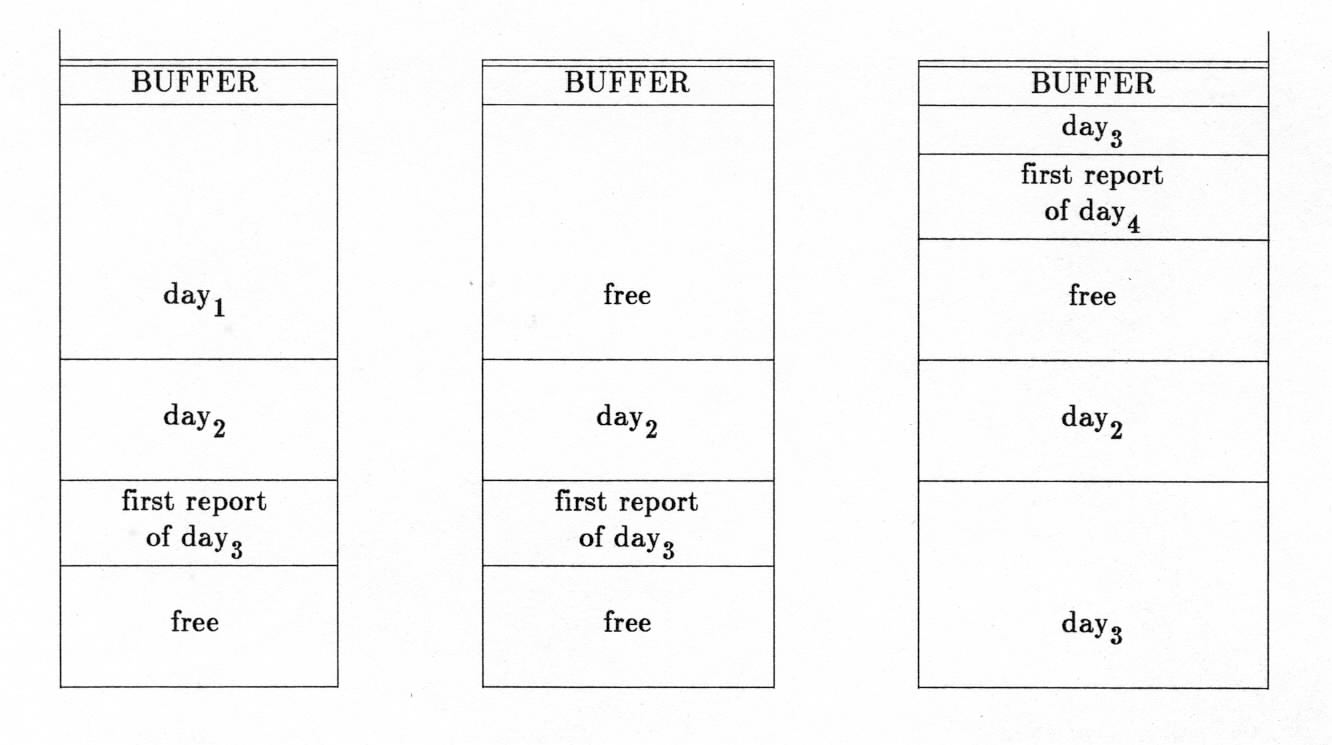
Figure K7-2 (left). Two full days of data plus the first report of day3
in buffer.
Figure K7-3 (middle). Day1 is output, space is no longer
used.
Figure K7-4 (right). Day3 is input, occupies bottom and top of
buffer.
The following terminology will be used when referring to days of data:
dayi = the day just read
dayi-1 = the day immediately before dayi
dayi+1 = the first report after dayi
There is always a dayi+1 in the buffer, since this report is the first one read that has a different day, month, 1° MSQ, etc. than dayi. On the other hand, there may not be a dayi-1 (i.e., the data skip a day, month, etc.), in which case the pointer for the beginning of dayi-1 is equivalenced to the pointer for the beginning of dayi, and the pointer for the end of dayi-1 is set to zero to indicate that there are no data in dayi-1. Once dayi-1 and dayi have gone through dupelim, if dayi+1 is in the same 1° MSQ, month, and year as dayi, and it is also the next consecutive day, then dayi-1 is output, dayi becomes dayi-1, and dayi+1 is the beginning of the new dayi. Otherwise, dayi-1 and dayi are both output, dayi+1 becomes the first report of dayi, and there is no dayi-1. Then the remaining reports are input for the new day.
7.3 Locating Duplicate Reports
Once the very first day's reports are input, they are scanned for possible pairs of dups by locating reports that are both XBT or not both XBT and have the same hour, are different by 1 hour, or are different by 6 or 7 hours (allowance #6). The following is an example of possible reports in a day:
              Index
Example 1.   location     Hour
             -------------------
                1           1
                2           1
                3           2
                4           3
                5           8
                6          10
                7          23
             -------------------
The order by index location in which comparisons might be made is
(1,2),(1,3),(1,4),...,(1,7),(2,3),(2,4),...,(6,7).But since the reports are sorted by hour, once the hour difference is greater than 7 there is no need to compare later reports, so the pairs (1,6) and (1,7) are skipped over and the next comparison made is (2,3).
These pairs are possible dups:
(1,2) - no crossWhen a pair is located, its seven weather elements (sea surface temperature, air temperature, sea level pressure, present weather, past weather, wind speed, and visibility) are compared. If weather elements exist in both reports, they are tested for equality, using allowances when applicable. A count is kept of the number of weather elements present and the number that are equal between the pair, and these counts as well as the type of cross between the pair determine whether or not they are dups.
(1,3) - hour cross
(1,5) - hour cross (allowance #6)
(2,3) - hour cross
(2,5) - hour cross (allowance #6)
(3,4) - hour cross
(3,5) - hour cross (allowance #6)
(4,6) - hour cross (allowance #6)
When a pair is identified as dups, substitutions are made if required (wind speed from HSST into Atlas, etc.) and quality codes are assigned by QC to each report. The dup status (DS) is assigned according to the values of the quality codes unless one of the reports is HSST and the other is from deck 192 or 193, in which case the latter is chosen over the HSST. If the quality code is the same for both reports, the one with highest priority according to its source ID is the best dup.
In cases where one or both dups already have a dup status (they are also dups with other reports), their values can be changed to a higher (worse) value but not lower. This means that a best dup may become uncertain or worse (or it may remain a best dup) but an uncertain or worse dup will not be made a best dup.
The dup check (DC) is then assigned to both dups according to whether both are GTS, as determined from the card deck of each report. If both are GTS or both are logbook then DC is 2. If one is GTS and the other is logbook then DC is 0, provided both sea surface temperature and sea level pressure are equal within allowances; otherwise DC is 1. If the dup check has been set for one or both reports already, its value can possibly be changed to a lower number but not higher.
Finally, if one report of a pair of dups has a bucket indicator of 2 and the other report has sea surface temperature present but the bucket indicator is missing, it is replaced with a value of 2.
After dups are located in dayi and those reports become dayi-1, the next day of reports is input and becomes the new dayi. Since dayi-1 has already been checked internally, it is necessary to compare only dayi-1 with dayi, and then to compare dayi internally.
Given the reports in Example 1, suppose a second day of reports is read in with the following hours:
              Index
Example 2.   location     Hour
             -------------------
                8           0
                9           1
               10           5
               11           5
               12          10
               13          20
             -------------------
Comparisons are made in this order:
(1,9) - day crossAfter dups within these pairs are located, the reports in the first day that are not worse may be output.
(2,9) - day cross
(6,12) - day cross
(7,8) - hour cross
(7,10) - hour cross (allowance #6)
(7,11) - hour cross (allowance #6)
(8,9) - hour cross
(10,11) - no cross
7.4 Preparing Reports for Output
Preparing reports for output (uncertain or better) requires these steps:
a) Get the quality code and flags for the unique reports.Not all of the variables in LMR are unpacked after input since this would be a waste of computer time and storage. Instead, packed LMR are maintained in storage, and whenever a value is to be substituted into a report the coded value is packed and the checksum is adjusted accordingly. The checksum is not repacked with each substitution, however, since it may be changed again if there are further substitutions throughout the program. The recomputed checksum, modulo 255, is repacked just prior to being output.
b) Pack the new dup status into LMR.
c) Pack the new dup check into LMR.
d) Pack the quality code and flags (QC attachment) into LMR.
e) Repack the new checksum into LMR.
Quality control data are returned from the QC subroutine in two parts, the packed flags and the quality code, which together become the first attachment in LMR. Since there may already be a supplemental and error attachment, the QC attachment must be inserted between the control section of LMR and any existing attachments. This is done by moving the other attachments to temporary locations, packing the quality control attachment to the end of the control section, and repacking the other attachments at the end of it.
7.5 Inventories
The inventories (see sec. 5.1) for each 10° box (BOX10) are
stored in one variable-length record in a binary bit-string format,
with a maximum record length of 198,240 bits, and one record per
block. The method of storing data is similar to that used for other
packed binary products (see supp. F, for example).
Owing to a different number of card decks and source IDs, the formats of the
pre-'70s (INV.1) and '70s (INV.2) were slightly different. For
distribution these have been consolidated as two separate files in a
single format (INV.3), which is identical to INV.2 except that end-of-file
marks within the pre-'70s and '70s have been removed. The format
for each record is given in Table K7-1.
 #     Field     Bits    Repeat     Repeat specification
--------------------------------------------------------------------------------
 1     BOX10       10     1-180     For each 10° box.
--------------------------------------------------------------------------------
 2   YEAR-1799      8       2-8     For each year with data.
 3      Im        *15       3-5     For each of the 12 months.
 4      Om        *15
 5      Dm        *15
 6      Isidy     *15       6-8     For each of the 17 source IDs (INV.1),
 7      Osidy     *15               or
 8      Dsidy     *15               for each of the 24 source IDs (INV.2/INV.3).
--------------------------------------------------------------------------------
 9   YEAR = 0       8     9-180     Once following the last year of data.
10      Isid      *20     10-12     For each of the 17 source IDs (INV.1),
11      Osid      *20               or
12      Dsid      *20               for each of the 24 source IDs (INV.2/INV.3).
13      Icd       *20     13-15     For each of the 49 card decks (INV.1),
14      Ocd       *20               or
15      Dcd       *20               for each of the 50 card decks (INV.2/INV.3).
16      It        *20
17      Ot        *20
18      Dt        *20
19      DS0       *20
 .       .        *20
 .       .        *20
 .       .        *20
26      DS7       *20
27      QC1,1     *20
28      QC2,1     *20
 .       .        *20
 .       .        *20
 .       .        *20
40      QC14,1    *20
41      QC1,2     *20
42      QC2,2     *20
 .       .        *20
 .       .        *20
 .       .        *20
180     QC14,11   *20
--------------------------------------------------------------------------------
The fields are abbreviated as follows:
I = number of reports inputsubscripted:
O = number of reports output
D = number of reports output that were uncertain dups
DSk = number of reports by dup status
QCi,j = QC flag
m = monthly total
sidy = yearly total by source ID
sid = grand total over all time by source ID
cd = grand total over all time by card deck
t = grand total over all time
k = grand total over all time of dup status k
i,j = grand total over all time of flag i for flag value j (see Table K7-2)
Table K7-2
QCi,j Flags (i) and Values (j)*
 i   Flag                          j   Flag value
-------------------------------------------------
 1   ship position                 1    missing
 2   wind                          2       R
 3   visibility                    3       A
 4   present weather               4       B
 5   past weather                  5       J
 6   pressure                      6       K
 7   air temperature               7       L
 8   wet bulb temperature          8       M
 9   dew point temperature         9       N
10   sea surface temperature      10       Q
11   cloud                        11       S
12   wave
13   swell
14   pressure tendency
-------------------------------------------------

* Because of subsequent reprocessing, QCi,j are not
accurate. They should be used only as estimates.
_______________________
When a number (x) is too large to store in n bits (i.e., x ≥ 2n - 1), it is stored in multiples of n bits. This possibility is indicated by prefixing the bits entry with an asterisk. In this case the first n bits are filled with all ones and the difference (x - (2n - 1)) is stored in the next n bits if it will fit. If the difference is still too large, this step is repeated until the difference, including a possible difference of 0, can fit into n bits.
Likewise, when unpacking the inventories, if the number unpacked is 2n - 1, the next n bits are unpacked and added to the first number. This is done repeatedly until the number unpacked is less than 2n - 1.
NOTE: When the inventories are being unpacked, if the unpacked value for the year is 0 before adding 1799, grand totals for the box follow. Otherwise, zero is the number of reports.
7.6 '70s Decade Dupelim
Most of the changes in dupelim for the '70s decade involved removal of allowances and substitutions pertaining to HSST data, since there were no HSST data in the '70s. Figure K7-1 indicates some of the changes made for the '70s data.
These changes were also included: