August 30, 1983
TO: Distribution
FROM: E/CC32 - Peter M. Steurer
SUBJECT: Marine Atlas Update (Correspondence #5)
A more complete surface marine data base has recently been created as part of a cooperative project among NCDC, ERL, CIRES, and NCAR. Attached is a report on the procedures used to determine whether the pre-1970's marine file just created is consistent with past files. Several extensive checks and comparisons were performed upon 1983 inventories of the new marine data base. In addition, a section of the report has been included describing data biases which were identified in past marine data sets as a result of this project.
Attachment
Distribution:
J. Fletcher, CIRES
T. Barnett, Scripps
A. Oort, GFDL
R. Reynolds, NWS
B. Weare, U. of California
R. Slutz, CIRES
R. Jenne, NCAR
E. Rasmusson, NWS
S. Woodruff, ERL
1. Introduction
The Cooperative Marine Data Project among NCDC, ERL, CIRES, and NCAR was designed to merge all available surface marine files into one. Several pre-1970 inventories were created by the Boulder group as part of this project. In order to determine if the current effort produced a consistent data base, in relation to past files, a thorough check of these inventories was performed by NCDC on every 10 degree Marsden Square1. In addition, the current 1983 total observation count for each 10 degree square was compared against the Atlas (TD 9760) count and a 1971 inventory of the original marine data base (TD 1100). The following report summarizes the results of these comparisons for pre-1970 data and also points out potential data biases which existed in past marine data sets.
_________________________
1The Marsden Square numbering system was changed by ERL-CIRES-NCAR
to better conform to geographic computer sorts. The "Boulder Square" numbering
system spirals down from the north pole as opposed to the Marsden Square system
which is more erratic. The NCDC decided to keep the Marsden Square system for
their archive while ERL-CIRES-NCAR chose the "Boulder Square" system. Since
these numbering systems are only arbitrary schemes for sorting the data base,
there are no major problems as long as the user knows which system is being
employed. However, if the two schemes are mixed (which will likely occur in
the long run), the resulting problems will range from subtle changes in data
to extreme discontinuities.
_________________________
2. Inventories and Types of Checks Performed
Each of the 17 data sets included in the current project was assigned a unique source identifier (ID). An inventory by 10 degree square was performed for each source ID for the entire period of record. See Figure 1 for a sample of this inventory. In addition, another similar inventory was performed for every 10 degree square except that the number of observations for each unique deck number was counted as opposed to source ID. See Figure 2 for a sample of this inventory.
Since extensive duplicate elimination tests were performed upon almost all the source IDs and deck numbers, a comparison could be made between the duplicate elimination test results and the actual observation counts for each 10 degree square. Discrepancies would indicate improperly functioning software, human error, or additional problems in marine data.
The procedures used in determining consistency for pre-1970 data for each 10 degree square and surrounding squares were as follows:
In addition to the inventories previously described in this report, several others were prepared at Boulder when the 1983 data base was created. These inventories are very detailed (including observation counts by year-month) and are available on magnetic tape.
3. Results of Tests and Comparisons
The total number of pre-1970s surface marine observations collected for this project was 74,505,031. Of this total, about 29% were deleted through duplicate elimination procedures as was expected. A total of 328,891 observations were uncertain duplicates and kept in the final Boulder data base but excluded from the NCDC file. This resulted in final output totals of 53,146,005 and 52,817,114 pre-1970 observations in the Boulder and NCDC data bases, respectively. This compares with the previous marine data base (Atlas) of 38,601,986 observations or around a 37% increase.
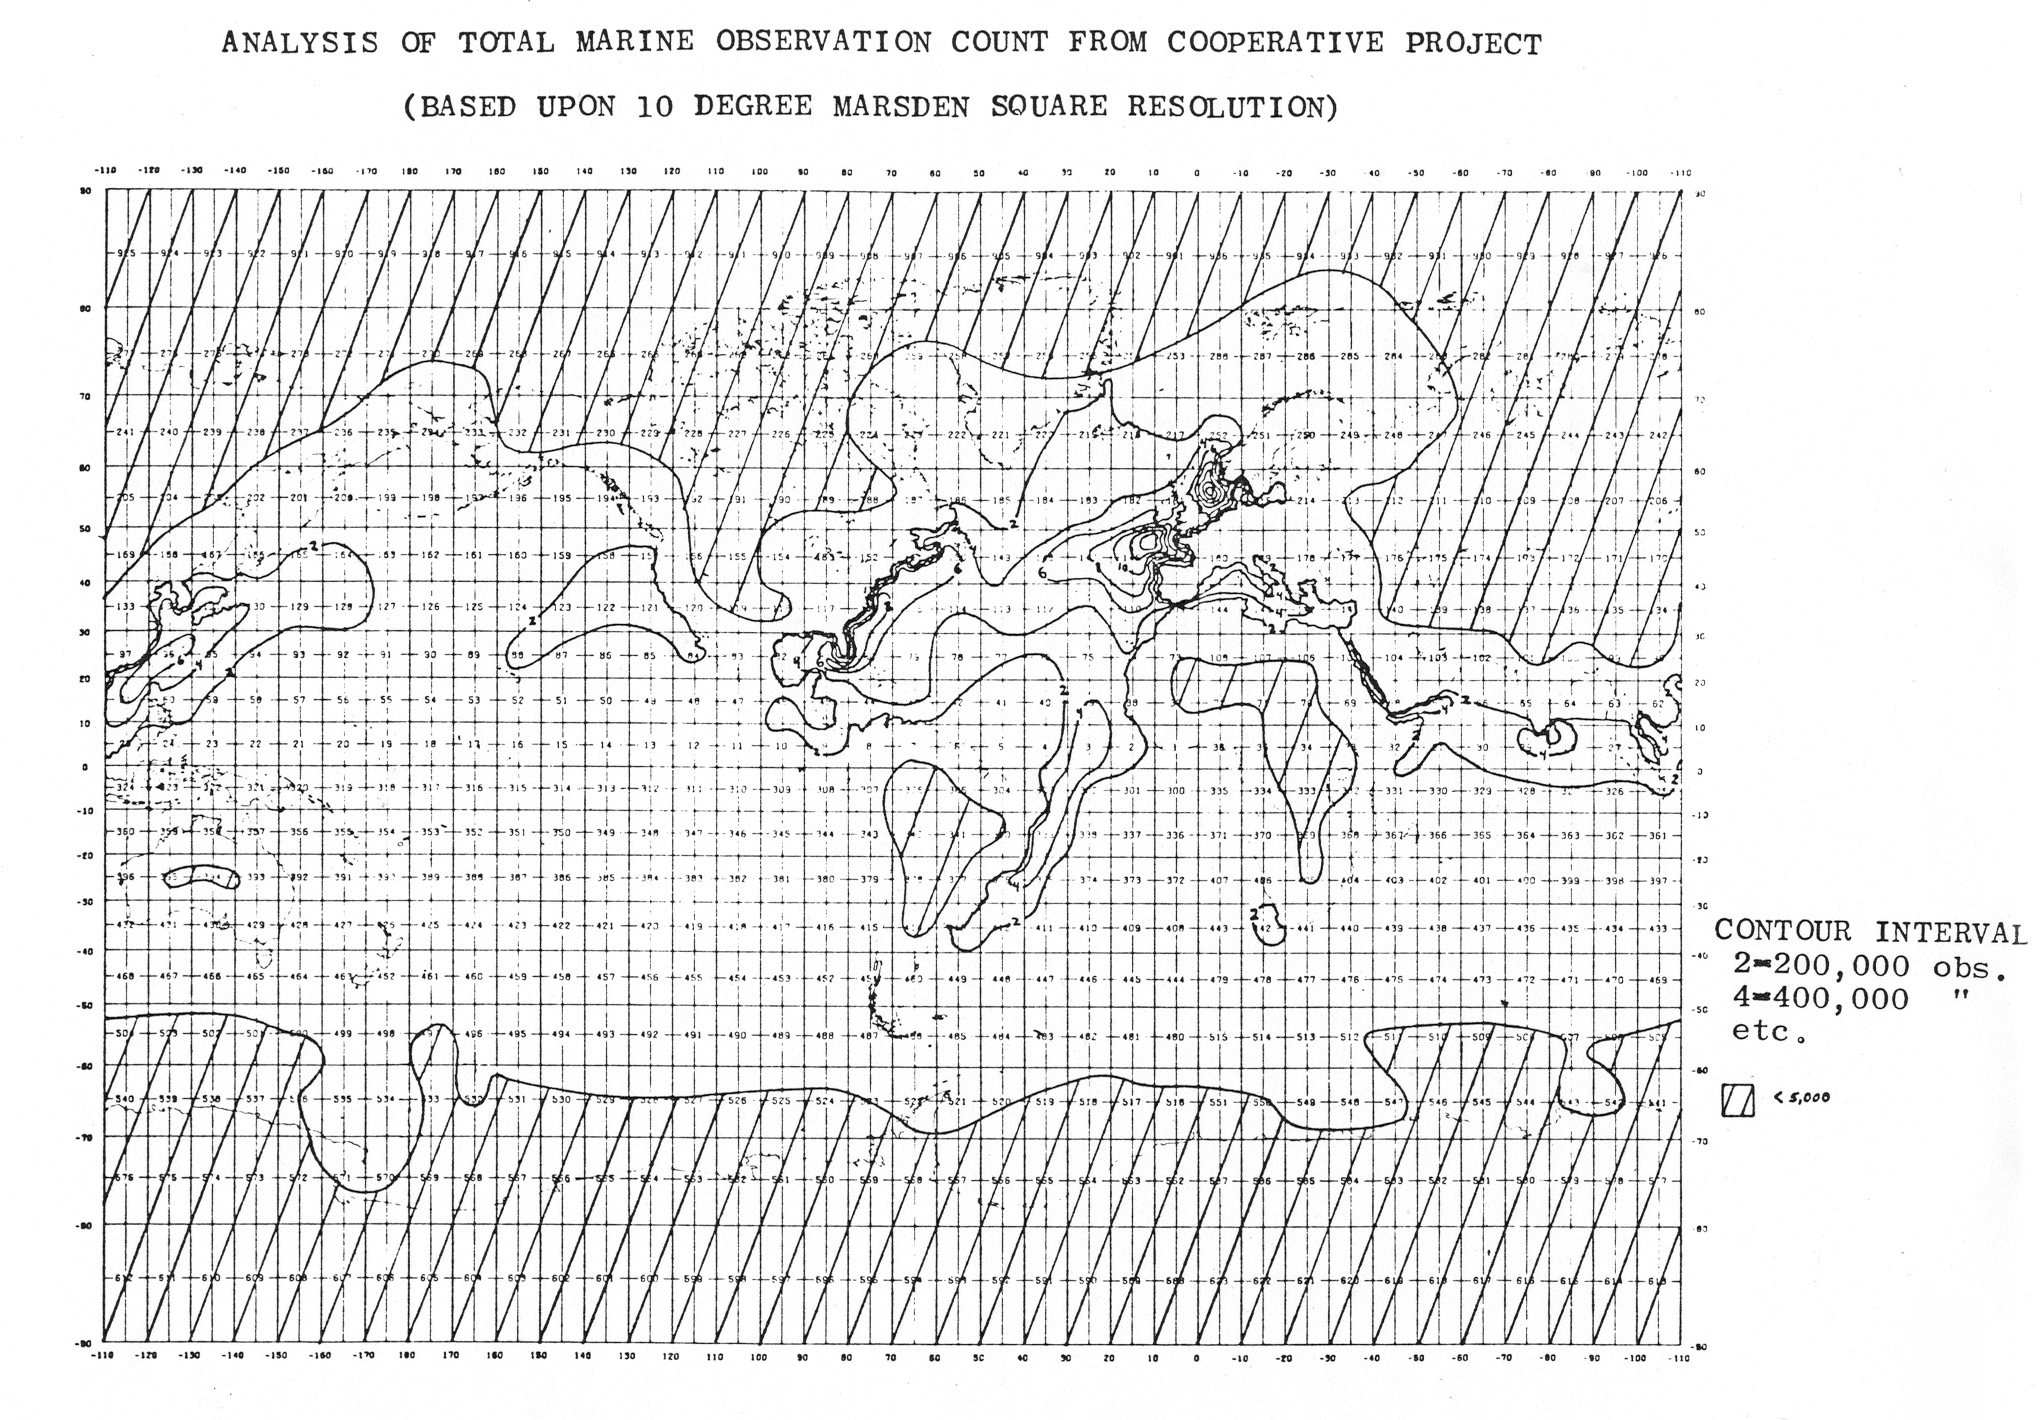
Figure 3 shows the total observation count for each 10 degree square plotted and hand analyzed according to the major shipping lanes. Isopleths were placed at intervals of 200,000 observations. The cross hatched areas signify locations with less than 5,000 observations. Some data are over land locked 10 degree squares. The source ID consistently responsible for this was Monterey Telecommunications and indicates potential erroneous observations. The average number of landlocked observations across the continental United States was around 150 while the number across central USSR was about 100. This represents a noise level of Monterey observations which probably should be taken into account when deck 555 is found in surrounding squares which are not landlocked. For example, if around 60 Monterey observations are consistently found in landlocked squares and 150 are found in a nearby square which is not landlocked, one might assume that only 90 observations are legal. This type of problem does exist in the Arctic Region. Due to the questionable quality of this data set, Monterey observations should be used with caution.
A more significant test of the new marine data base was made through the comparison of the 1983 total observation count for each 10 degree square against the observation count for the Atlas and a 1971 inventory of the original marine-data base. A normal pattern for each 10 degree square would be for an increase in observation count since the original marine data base was created. This type of check revealed two data processing errors both originating at NCDC.
The first error concerned a large discrepancy in observation count for Marsden Square 142 (Box 216). Inventories of the Atlas (TD 9760) showed 706,682 observations for the 10 degree box. This did not compare with 432,273 observations counted during a 1971 inventory. Of the 706,682 Atlas observations in Marsden Square 142, all but 415,202 were deleted through duplicate elimination processing at Boulder. This output total was now consistent with past inventories indicating a probable duplication error somewhere in NCDC processing. The origin of these duplicate observations likely came about when the Atlas basin work tapes were crunched to the final library tapes for NCDC Archives. This presents no problem to the current project because no data were lost and all duplicate observations were deleted. However, the problem still remains in NCDC Archives and should be corrected.
The second error resulted in a large data loss from Marsden Square 105 (Box 217). A check of the Atlas inventory for this square showed few observations after 1929 or a loss of about 113,000 records. Further investigation revealed that two of the original marine data base tapes (TD 1100) were left out when the Atlas was created. This represents a significant amount of data for that 10 degree box. The missing data were sent to Boulder and will be merged into the 1983 data base.
In order to compare the change in marine observation count with time for areas across the world, the percent change of total record count for each 10 degree square was calculated, plotted, and analyzed. Figure 4 shows the percent change of observation count for each 10 degree square between the current 1983 Boulder total and the 1970's Atlas total. Isopleths were placed at intervals of 50%. Areas with greater than a 250% increase were shaded while areas which showed a decrease in observations are cross hatched.
Referring to Figure 4, only 3 areas had a decrease in observation count. Marsden Square 142 (Box 216) showed a large decrease but was due to incorrect magnetic tape assignments as explained in a previous paragraph. The most notable and largest area where data had uniformly decreased was in the South Pacific. In this area (and only this area), HSST data had already been merged into the original marine data base in order to create the Atlas. The duplicate elimination plan used to create the Atlas did not identify as many duplicates as this project because the scheme was not based upon the large number of problems which existed in HSST data (average difference between 5 and 10%). This difference in procedures to eliminate duplicates also explains the small decrease in observation count for Marsden Square 273 and 274 (Boxes 49 and 48).
The remainder of the world showed a general increase in observation count. The largest increases were in the Atlantic Ocean and generally south of 50° south latitude. With some exceptions, most other areas showed a uniform increase of less than 50% since the 1970s Atlas was created. Some of the more notable increases are explained in the following paragraphs.
The area south of 50° south latitude had large increases with many Marsden Squares doubling and tripling in observation count. However, it must be remembered that most of these Polar squares had very low observation counts to start so large percent increases were possible. The major contributors to this area were the Japanese and South African Whaling data sets. An exception was Marsden Square 486 (Box 531). In this square the data sets HSST Atlantic and TDF 11 486 contributed over 100,000 and 62,000 observations respectively and resulted in a tremendous increase. This was expected because data from a portion of Marsden Square 486 were lost during some stage of processing when the Atlas was created. This project has rectified that error.
The Marsden Squares containing the coast lines of Australia showed occasionally large increases. This was primarily due to the Australian, IMMPC, Supplemental C TDF 11, and HSST data sets. The pattern is similar to the area along the coast of India. The data sets responsible for these increases were Supplemental C TDF 11 and HSST Indian.
Large percent increases were found throughout much of the Atlantic Ocean. Many 10 degree squares gained a few to several hundred thousand observations as a result of this project. These areas of large observation increases can easily be shown by mentally overlaying the total observation map (Figure 3) with the percent increase map (Figure 4). Note the area in the North Sea. Marsden Square 216 (Box 142) showed a 170% or about a 1 million increase in observation count. Much of this was due to HSST Atlantic observations as was the case for other squares in the Atlantic. This was expected because the Germans reportedly back punched older log books as part of the HSST project. Back punching of observations probably also explains the southern portion of the Barents Sea which also had large increases. However, Supplemental B TDF 11 also contributed much to this increase.
On and off station vessels (OSV data set) contributed significant amounts of data but mainly in concentrated areas in the North Atlantic and Pacific Oceans. OSV's were handled separately in Atlas processing and were not a part of the roving ship files. Marsden Squares 123, 128, and 195 (Boxes 199, 194, and 127) all showed substantial increases relative to surrounding areas. Marsden Square 220 (Box 102) near the southeast coast of Greenland sustained over a 200%.increase mainly due to the OSV data set but also HSST Atlantic.
The check of total input and output counts for each source ID and deck number proved to be important mainly during the initial stages of duplicate elimination software testing. Additional special allowances were created when it was found that duplicate HSST data were being kept (because of a slightly better quality code) over historical decks 192 and 193. In addition, a data processing problem was discovered during software testing. Magnetic tape assignments for a square in the North Pacific were mixed up at NCAR resulting in one Atlas tape being loaded twice while the second tape was left out entirely. This caused a 50% deletion rate in the Atlas. Since the error was discovered and corrected during test stages, no loss of data occurred.
The total number of uncertain duplicates for each 10 degree square was checked very closely since this would point out additional marine data problems missed during duplicate elimination testing. Another problem was uncovered involving deck 128. Almost 9,500 deck 128 observations were uncertain duplicates in Marsden Square 195 (Box 127). The problem involved deck 128 observations matching each other exactly except that wind speed in one observation was double that of the other observation. Closer examination revealed that this error for deck 128 occurred in many other squares except to a much smaller extent. The problem is likely a mix up in conversion since a value in meters per second is almost twice as large as the value converted to knots. This wind speed bias for deck 128 remains unresolved in the current marine data base.
The Monterey file had a large number of uncertain duplicates contributing about 30 to 40% to the total number for all Marsden Squares. This was not a great surprise since the Monterey data set was of questionable quality to start. Other contributors to the uncertain duplicate pool were deck 194, HSST, deck 189, and deck 116. The majority of these duplicates had day cross problems which had already been discovered during duplicate elimination testing.
4. Data Biases in Previous Marine Files
The creation of the new marine data base has resulted in the discovery of several data biases which existed in the last marine file (Atlas) but have since been corrected in the current file. These biases have primarily come about through differing duplicate elimination procedures used in creating the two files. In addition, human error resulted in the deletion or addition of large amounts of data for a few 10 degree squares. Past statistical studies performed upon Atlas data could be altered if new summaries were run - particularly time series studies. Therefore, all known biases are discussed in the following pages.
The large deletion or addition of data for specific Marsden Squares was discussed in Section 3 of this report. They involve Marsden Squares 142, 105, and 486 (Boxes 216, 217, and 531). Incorrect observation counts were found in these three squares and were the result of human error. For Marsden Square 142, the statistical studies which produced the Atlas Summaries were not affected by the incorrect observation counts (i.e. the human error occurred after the studies were performed). However, the Atlas Summaries for Marsden Square 105 and 486 were biased to a degree because data were erroneously excluded.
Another data bias probably occurred in the North Atlantic. Examination of original inventories (see Figure 5) of card deck 189 (Dutch Marine after 1938) showed no observations in the Mediterranean Sea and in the Atlantic Ocean north of the equator. This is an obvious data loss since surrounding ocean basins had substantial numbers of observations. Further investigation revealed that back in the middle 1950's the data were never acquired from the Dutch because (1) a large volume of North Atlantic and Mediterranean Sea data already existed at NCDC; (2) the purpose of acquiring the data was to prepare an atlas and the cost could not be justified for these already data rich areas. The volume of data that was not acquired because of these decisions was probably quite large. Whether these punch cards were sent to NCDC at a later date is unknown at this time. However, it is known that there were large increases in observation count for the North Atlantic as a result of this project primarily due to HSST data (see Figures 3 and 4). Possibly the missing deck 189 data have found their way back into the marine file in the form of HSST. Whatever the case, statistical summaries across the North Atlantic could change as a result of this large increase in record count.
The area south of 50° south latitude also showed large increases and like the North Atlantic could produce different statistical results. However, this area is also complicated by a data bias which has existed between decks 188 and 192 and decks 194 and 197. Because of a less stringent check upon location in the current duplicate elimination plan, deck 188 was found to be a complete duplicate with deck 192 within the Atlas file. Based upon further research, it was found that the original records from deck 188 (Norwegian Whaling Ships) were probably captured by the Germans and rekeyed during the Nazi Regime under deck 192. The duplication problem came about because ship coordinates in deck 188 were keyed to tenths of a degree while those in deck 192 were only keyed to whole degrees. When data were converted to TDF 11, the tenths positions for deck 192 were placed at zero while those for deck 188 were placed at the keyed value. The duplicate elimination plan which created the Atlas required location to be exact (i.e. to tenths of a degree latitude and longitude). Therefore, most deck 188 and 192 observations were considered unique when in fact they were duplicate. The effect of this upon the Atlas data base might be significant since the Polar areas have a very low number of observations.
A similar problem was found between observations in decks 194 and 197 within the Atlas. Deck 197 is composed of Danish Marine observations from Polar areas but also contains special Antarctic voyages of two British research vessels. The problem is that the British also keyed these special voyages under deck 194 but only to whole degrees latitude and longitude. Since deck 197 was keyed to tenths of a degree, the same type of duplicate elimination problem occurred as described for decks 188 and 192. Both of these data biases appear to have been eliminated as a result of this project.
It is important to note that the data biases just described dealt only with data processing problems. No attempt has been made to describe the biases associated with changes in observing technique and instrumentation used to measure each individual weather element. These biases still exist probably to a very high degree. Any statistical study involved with long term trends in climate could be influenced by these instrumentation and observing biases and might lead to incorrect assumptions.
5. Conclusion
The computer processing which created the new surface marine data base has produced consistent results in relation to past marine files. This is based upon extensive checks and comparisons of inventories and duplicate elimination results for every 10 degree Marsden square. The few major data problems identified have been or will be corrected.
The new marine data base contains around 53 million observations which is about a 37 percent increase over the previous file (Atlas). Most areas across the world showed a general increase in observation count of less than 50 percent when compared with the Atlas. Some larger increases were in the Atlantic Ocean and around Antarctica.
Several data biases were discovered in the Atlas file and might have produced incorrect statistical summaries for past projects. These biases came about through human error and differing duplicate elimination procedures but have been corrected. However, no attempt has been made to describe the biases which exist for each individual weather element. The new file is of much higher quality but still contains problems and will require additional research and testing to fully resolve historical marine data.
PROCESSING RESULTS OF PRE-70 MARINE DATA FOR BOXES 211 THRU 211 BY DUPELIM.02D 05/07/83 10:56:04
   211KBX221  1TL0588  478129  6611  3324972  04/07/83  05/48/05
0SUSPICIOUS ERROR ATTACHMENT,1,NCR,LTH  1  0  16

LRECS/PRECS/WDS  478129  6611  3120060  INPUT FROM KBX211
LRECS/PRECS/WDS  478129  6611  3120060  TOTAL INPUT

SUMMARIES FOR BOX 211 FROM 1854 THRU 1969 BY DUPELIM.02D 05/07/83 10:56:04
TOTAL READ = 478129  TOTAL OUT = 351336  TOTAL UNCERTAIN = 852

                                     DUPLICATE ELIMINATION
                                     ---------------------
SID      IN       OUT     UNCERTAIN   DELETED   % DELETED
=========================================================
  1    227526   226147       267        1379       0.61
  2         0        0         0           0       0.00
  3         0        0         0           0       0.00
  4    180091    79867        15      100224      55.65
  5     16199    13693        59        2506      15.47
  6        84       74         7          10      11.90
  7     14149     8163       434        5986      42.31
  8         1        1         0           0       0.00
  9         0        0         0           0       0.00
 10         0        0         0           0       0.00
 11      4115     3780         0         335       8.14
 12       130       53         0          77      59.23
 13         0        0         0           0       0.00
 14         0        0         0           0       0.00
 15         0        0         0           0       0.00
 16        72       32         0          40      55.56
 17     35762    19526        70       16236      45.40
=========================================================
       478129   351336       852      126793      26.52


SOURCE IDENTIFICATION (SID) KEY:
 1 - ATLAS
 2 - HSST PACIFIC
 3 - HSST INDIAN
 4 - HSST ATLANTIC
 5 - SUPPLEMENTAL B TDF 11
 6 - SUPPLEMENTAL C TDF 11
 7 - MONTEREY TELECOMMUNICATIONS
 8 - OSV
 9 - OSV SUPPLEMENT
10 - TDF 11 FOR MARSDEN SQUARE 486
11 - NODC
12 - NODC SUPPLEMENT
13 - ELTANIN CRUISES SUBSET
14 - JAPANESE SET
15 - SOUTH AFRICAN WHALING SET
16 - AUSTRALIAN SET
17 - IMMPC
Figure 1. Sample inventory of Marsden Square 111 (Box 211) by Source Identifier (SID)
SUMMARIES FOR BOX 211 FROM 1854 THRU 1969 BY DUPELIM.02D

                                     DUPLICATE ELIMINATION
                                     ---------------------
 CD      IN       OUT     UNCERTAIN   DELETED   % DELETED
=========================================================
110      1933     1836         4          97       5.02
116     69228    69180       100          48       0.07
117         0        0         0           0       0.00
118       105      105         0           0       0.00
119        83       83         2           0       0.00
128     74868    71203       145        3665       4.90
150         0        0         0           0       0.00
151         0        0         0           0       0.00
152         0        0         0           0       0.00
155         0        0         0           0       0.00
156    180091    79867        15      100224      55.65
184      3386     3379         1           7       0.21
185         0        0         0           0       0.00
186         0        0         0           0       0.00
187         0        0         0           0       0.00
188         0        0         0           0       0.00
189         0        0         0           0       0.00
192     35326    35322        10           4       0.01
193     35153    35151         1           2       0.01
194     18862    18793        27          69       0.37
195      3792     3790        40           2       0.05
196         0        0         0           0       0.00
197         0        0         0           0       0.00
281      1074     1073         3           1       0.09
555     14149     8163       434        5986      42.31
666         0        0         0           0       0.00
849         0        0         0           0       0.00
850         0        0         0           0       0.00
876         0        0         0           0       0.00
878         0        0         0           0       0.00
879         0        0         0           0       0.00
880         0        0         0           0       0.00
881         0        0         0           0       0.00
882         0        0         0           0       0.00
888         0        0         0           0       0.00
889         0        0         0           0       0.00
891      4245     3833         0         412       9.71
897         0        0         0           0       0.00
898         0        0         0           0       0.00
899         0        0         0           0       0.00
900        72       32         0          40      55.56
901         0        0         0           0       0.00
902         0        0         0           0       0.00
926     35762    19526        70       16236      45.40
927         0        0         0           0       0.00
928         0        0         0           0       0.00
999         0        0         0           0       0.00
 49         0        0         0           0       0.00
=========================================================
       478129   351336       852      126793      26.52

CARD DECK (CD) KEY:
110 - U.S. NAVY MARINE OBSERVATIONS
116 - U.S. MERCHANT MARINE
117 - NAVY HOURLY (U.S.)
118 - JAPANESE SHIP OBSERVATIONS No. 1
119 - JAPANESE SHIP OBSERVATIONS No. 2
128 - INTERNATIONAL MARINE OBSERVATIONS
150 - HSST PACIFIC (DUTCH SOURCE)
151 - HSST PACIFIC (GERMAN SOURCE)
152 - HSST PACIFIC (BRITISH SOURCE)
155 - HSST INDIAN
156 - HSST ATLANTIC
184 - GREAT BRITAIN MARINE OBSERVATIONS
185 - U.S.S.R. MARINE SYNOPTIC OBSERVATIONS
186 - U.S.S.R. ICE OBSERVATIONS
187 - JAPANESE WHALING FLEET OBSERVATIONS
188 - NORWEGIAN WHALING FLEET OBSERVATIONS
189 - NETHERLANDS MARINE OBSERVATIONS
192 - DEUTSCHE SEEWARTE MARINE OBSERVATIONS
193 - NETHERLANDS MARINE OBSERVATIONS
194 - GREAT BRITAIN MARINE OBSERVATIONS
195 - U.S. NAVY SHIP LOGS
196 - DEUTSCHE SEEWARTE MARINE OBSERVATIONS
197 - DANISH MARINE OBSERVATIONS
281 - U.S. NAVY MAR MARINE OBSERVATIONS
555 - MONTEREY TELECOMMUNICATIONS
666 - TUNA REPORTS
849 - FIRST GARP GLOBAL EXPERIMENT (FGGE)
850 - GERMAN FGGE
876 thru 882 - NOAA DATA BUOY OFFICE (DBO)
888 - GLOBAL WEATHER CENTER TELECOMMUNICATIONS
889 - AUTODIN TELECOMMUNICATIONS
891 - NODC
897 - ELTANIN SUBSET
898 - JAPANESE SET
899 - SOUTH AFRICAN WHALING SET
900 - AUSTRALIAN SET
901 - CONTAINS OBSERVATIONS WITH EXTREME SEA TEMP.
902 - DECK 184 EXTENSION
926 - WMO FOREIGN EXCHANGE (IMMPC)
927 - WMO FOREIGN EXCHANGE (IMMPC)
928 - OCEAN STATION VESSEL (OSV)
999 - TELECOMMUNICATIONS (ETAC)
Figure 2. Sample inventory of Marsden Square 111 (Box 211) by Deck Number (CD)
Figure 3. Analysis of total marine observation count from cooperative project, based upon 10 degree Marsden Square resolution.
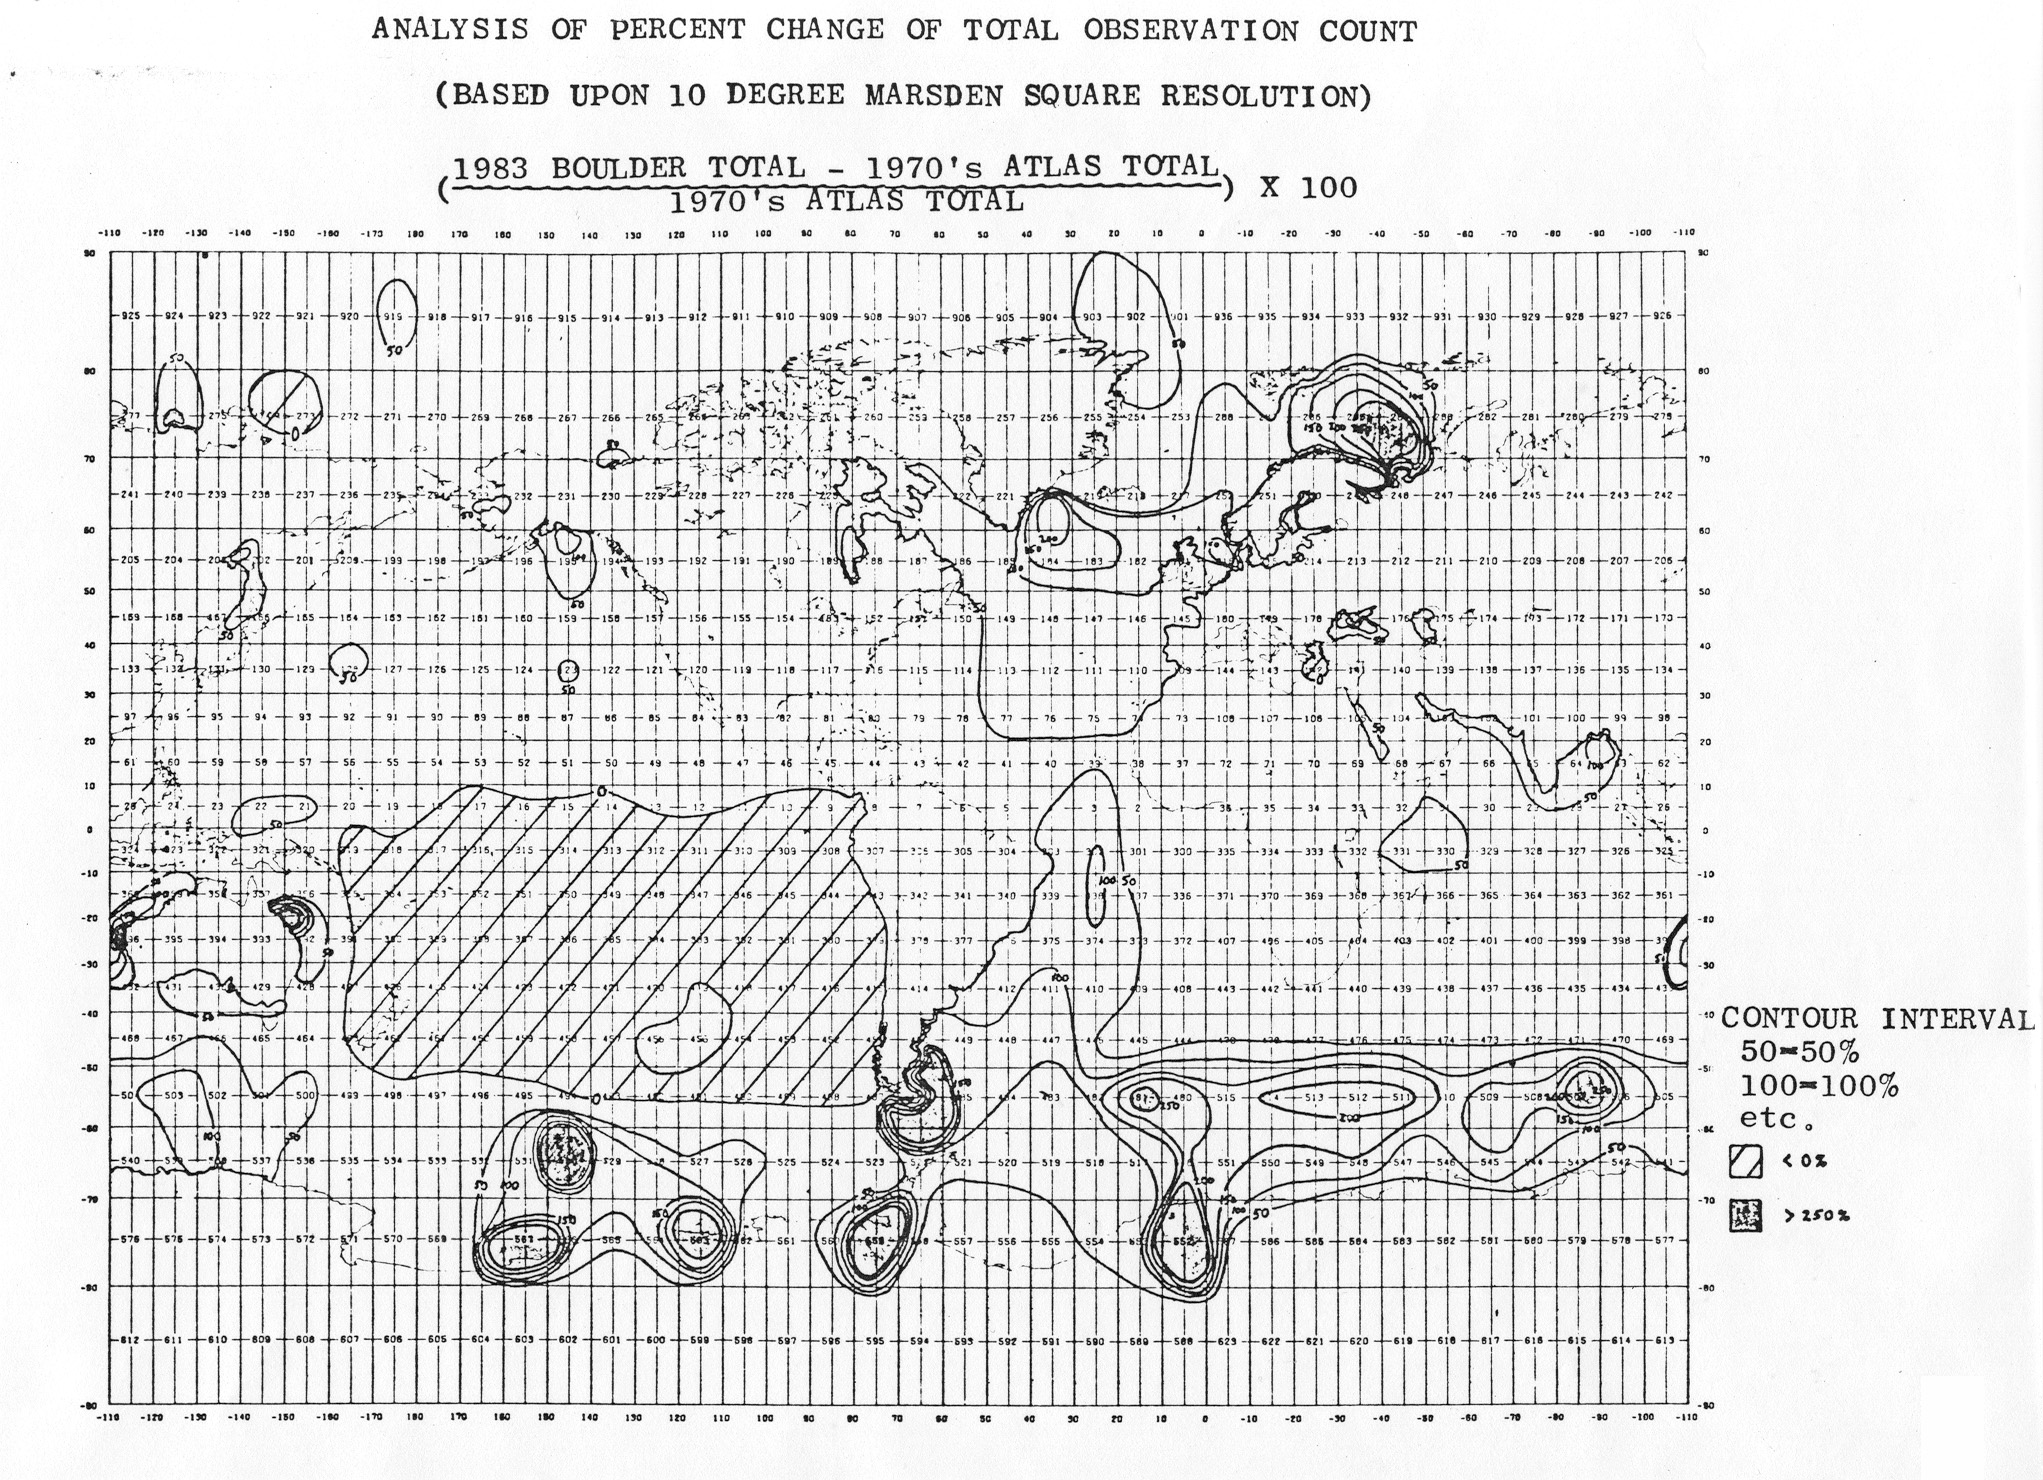
Figure 4. Analysis of percent change of total observation count, based upon 10 degree Marsden Square resolution.
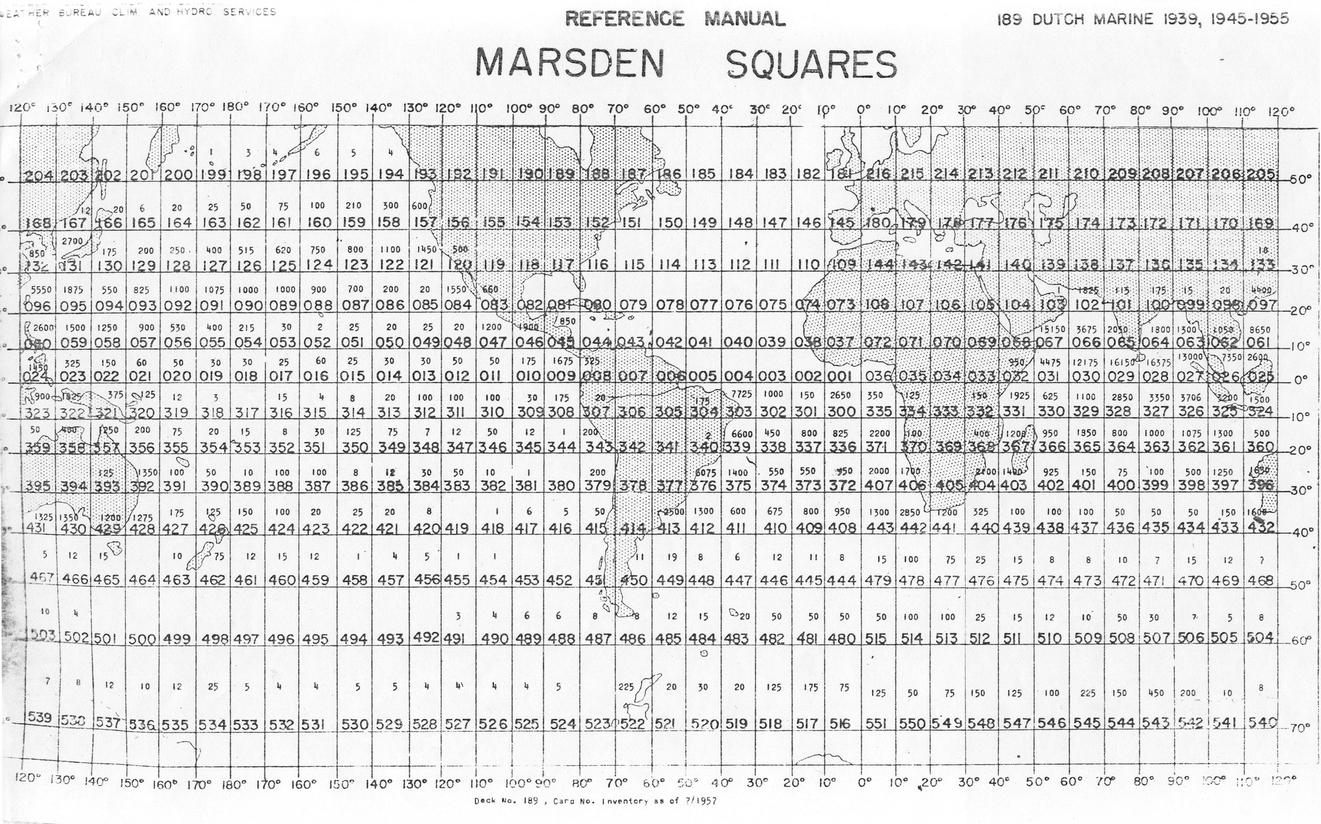
Figure 5. Original Inventory of Card Deck 189. Upper number in each square is the observation count (blank is zero). Lower number in each square is the Marsden Square number. (Note: The observation counts appear to be estimates.)