
| Data and Documentation | Chronology and News | Program Status | Publications | Related Data and Resources | Contact Points |
ICOADS Web information page (Wednesday, 11-May-2016 19:00:21 UTC):
German Maury Collection (deck 721; 1845-68) (by ESRL)
Introduction
This collection was loaned to NCDC by the Deutscher Wetterdienst (DWD) for imaging (Braun 2000; completed in 2005), followed by digitization by the NOAA Climate Database Modernization Program (CDMP; completed in 2006). DWD (2001) provides an inventory, and NCDC (2010) provides the keying format. The translation (specifications) into IMMA format considered issues of data homogeneity with the US Maury Collection (Woodruff et al. 2005; translation webpage), and characteristics of (at least) the US Maury data, e.g. biased sea level pressure (SLP) observations, as studied by KNMI (Wallbrink et al. 2009). Partly in contrast to the US Maury Collection with its greater diversity in form types during earlier years (ref. this figure), this Collection consists primarily (~63%*) of a form type with five reports/day (similar example from US Maury Collection) and secondarily of a type with 14 reports/day (similar example). The five reports/day form type is also illustrated in Fig. 3 of Braun (2000).
As with the US Maury Collection (translation specifications), if SLP was extant the pressure bias (PB) flag was set as follows, depending on whether a temperature correction was applied (a gravity correction was always applied):
PB=1: temperature and gravity corrections appliedConversely during the analysis to develop this webpage PB was temporarily set (note: not officially documented IMMA format values):
PB=2: only gravity correction applied
PB=3: only temperature correction applied
PB=4: neither correction applied
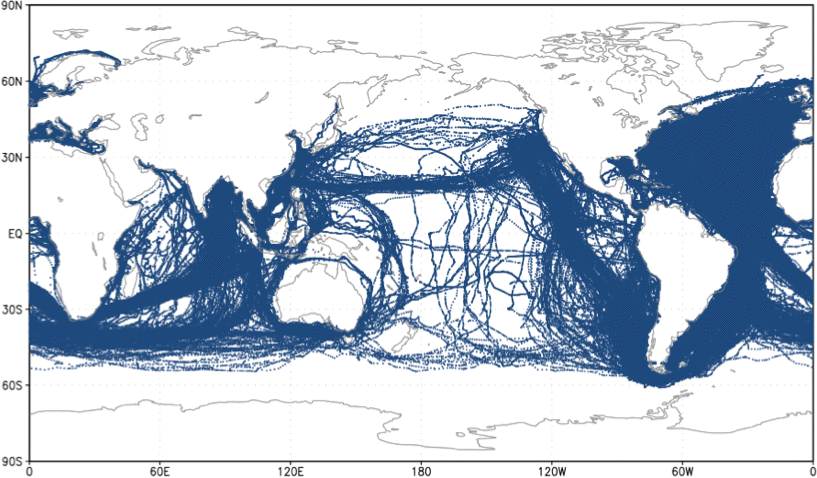
Figure 1. Location of the digitized German Maury marine reports.
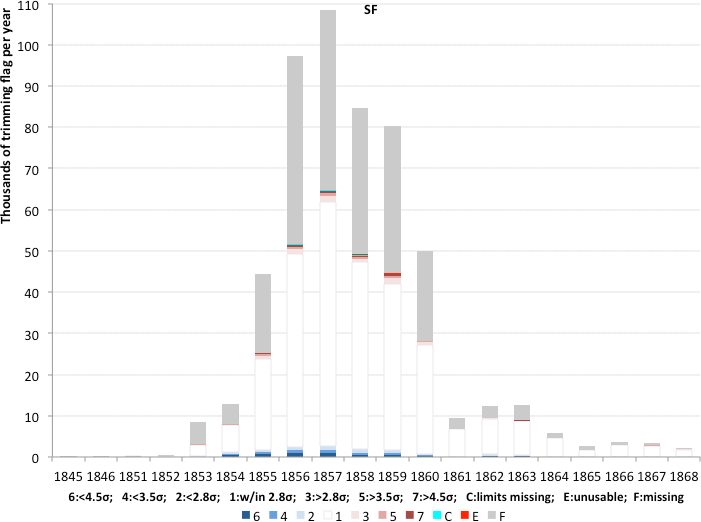
Figure 2. Number of the digitized German Maury marine reports per year and response of individual observational variables to the ICOADS trimming (QC) procedure, with results (note: revealed by activating links within the figure caption) shown separately for the QC flags associated with these variables: sea surface temperature (SF), air temperature (AF), U-wind (UF), V-wind (VF), and sea level pressure (PF). Response of the SLP data is also shown separately for: the subset subject to both corrections (PB 1), gravity correction only (PB 2), the subset subject to temperature correction only (PB 3), and uncorrected (PB 4). See Figs. 7a-7f on this webpage for a more detailed explanation of the trimming flag values: icoads.noaa.gov/r2.5.html.
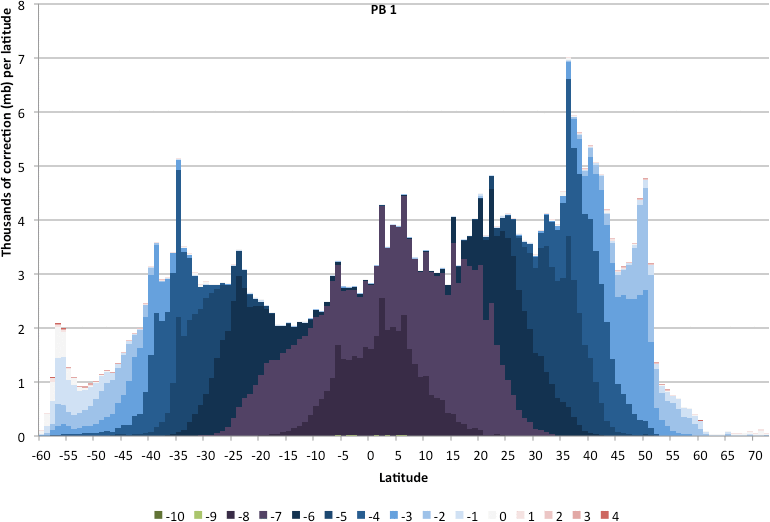
Figure 3. Number (left axis) and magnitude (bar colors) of SLP correction (mb), by latitude: for the subset subject to both corrections (PB 1), for this subset but subject only to the gravity correction (PB 2), and for this subset but subject only to the temperature correction (PB 3).
Footnote
* Unfortunately the keying format developed by CDMP lacked form type as a field, thus the "(~63%)" was determined from the files in which 100% (to whole percent) of the time hour was one of {4,9,12,15,20} excluding files in which 100% of the time hour was {12}.
References
Braun, D.S., 2000: Scientific vision, a passion for observation, and the impetus for change: Germany loans Maury logs to the National Climatic Data Center. Earth System Monitor, 11(1), 4-7. (pdf; 14.3MB)
DWD, 2001 (approx.): Inventory of the German Maury Collection [spreadsheet: 00000003-german_maury.xls].
NCDC, 2010 (approx.), Keying Format for Maury Journals (German set) - First & Second Groups.
Wallbrink, H., F. Koek, and T. Brandsma, 2009: The US Maury Collection Metadata 1796-1861. KNMI-225/HISKLIM-11 (http://www.knmi.nl/bibliotheek/knmipubmetnummer/knmipub225.pdf)
Woodruff, S.D., H.F. Diaz, S.J. Worley, R.W. Reynolds, and S.J. Lubker, 2005: Early ship observational data and ICOADS. Climatic Change, 73, 169-194 (doi:10.1007/s10584-005-3456-3).
Appendix
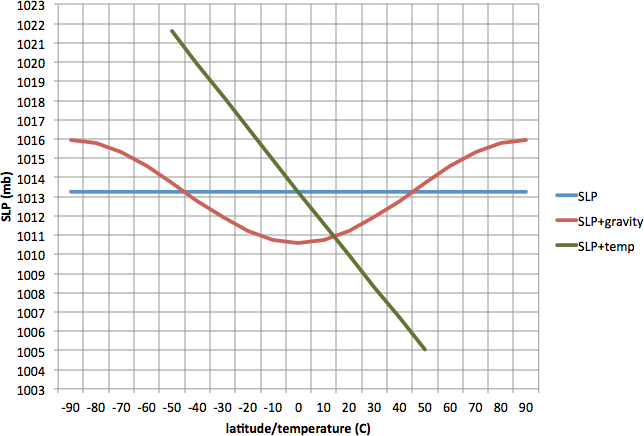
Figure 4. Plots of SLP gravity/temperature correction magnitudes simply with respect to latitude/temperature. The Fortran code used to apply these corrections to actual data (as illustrated in Fig. 3) is available in lmrlib, specifically routines {fwbptf,fwbptc} (correction value for temperature), and {fwbpgv} (correction value for gravity, using gmode=2 for pre-1955 data). If the original temperature units were Fahrenheit (Celsius), barometer units were required to be inches (millimeters) and temperature was required to fall within the range -50:50C.
[Documentation and Software][Links to additional]
U.S. National Oceanic and Atmospheric Administration hosts the icoads website privacy disclaimer
Document maintained by icoads@noaa.gov
Updated: May 11, 2016 19:00:21 UTC
http://icoads.noaa.gov/maury_german.html