
| Data and Documentation | Chronology and News | Program Status | Publications | Related Data and Resources | Contact Points |
International Comprehensive Ocean-Atmosphere Data Set (ICOADS)
ICOADS Figure 3
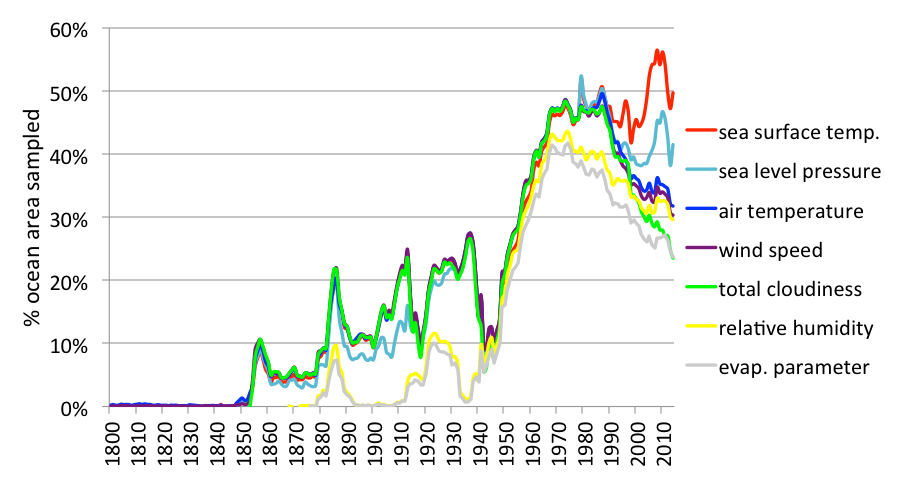
Figure 3. Percentage global ocean and coastal area (1800-2014) sampled in Release 3.0 based on area-weighted 2° boxes (smoothed) for sea surface temperature (S), requiring at least five observations per month in each box, and determined from the "enhanced" (4.5σ trimming) product that includes ship and buoy records. Other curves compare the S coverage, at five observations per month, with that for sea level pressure (P), air temperature (A), wind speed (W), total cloudiness (C), and relative humidity (R). Also plotted is the evaporation parameter (G), which is computed from S, P, A, W, and dew point temperature, and thus illustrates the extent to which surface fluxes can be computed from the individual observations.
U.S. National Oceanic and Atmospheric Administration hosts the icoads website privacy disclaimer
Document maintained by icoads@noaa.gov
Updated: Jun 21, 2016 19:58:24 UTC
http://icoads.noaa.gov/index_fig3.html