
| Data and Documentation | Chronology and News | Program Status | Publications | Related Data and Resources | Contact Points |
International Comprehensive Ocean-Atmosphere Data Set (ICOADS)
Chronology and News Figure 3
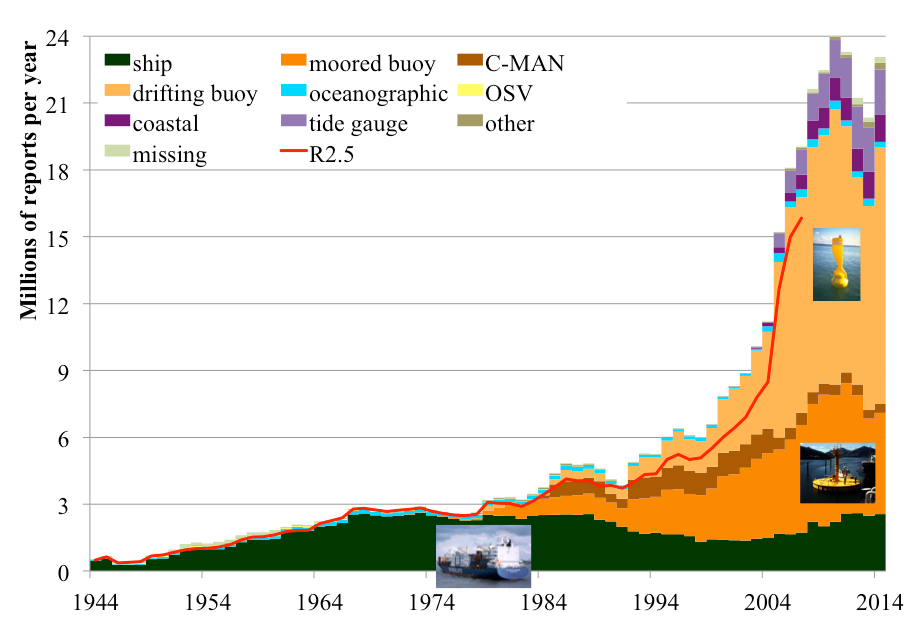
Figure 3. Annual distribution (1944-2014) of major platform types in Release 3.0 shown as millions of reports per year. The red line curve shows the Release 2.5 annual counts. Ships (mainly VOS plus some R/Vs), buoys, oceanographic, coastal, and tide gauge are self explanatory, Ocean (permanent) Station Vessel = OSV, Coastal-Marine Automated Network = C-MAN, ocean drilling rigs/platforms and other small entities = other, and unidentified platform types = missing. (Ship photo courtesy of www.ShipPhotos.co.uk.) Figure adapted from: Woodruff, S.D., H.F. Diaz, E.C. Kent, R.W. Reynolds, and S.J. Worley, 2008: The evolving SST record from ICOADS. In Climate Variability and Extremes during the Past 100 Years (S. Brönnimann, J. Luterbacher, T. Ewen, H.F. Diaz, R.S. Stolarski, and U. Neu, Eds.), Advances in Global Change Research, Vol. 33, Springer, 65-83.
U.S. National Oceanic and Atmospheric Administration hosts the icoads website privacy disclaimer
Document maintained by icoads@noaa.gov
Updated: Jul 1, 2016 19:54:50 UTC
http://icoads.noaa.gov/news_fig3.html