Comprehensive Ocean-Atmosphere Data Set; Release 1
Supplement J: Quality Control Flowchart
0. Introduction
COADS contains data from numerous and varied sources. Reports
were obtained from ship logs, ship weather reporting forms, published
ship observations, automatic observing buoys, fixed platforms such as
oil rigs, teletype reports, Global Telecommunication System (GTS)
reports, and data on cards or magnetic tape that were acquired from
foreign meteorological services.
Instrumentation varied from that found aboard a 19th Century
Clipper ship to the sophisticated equipment aboard today's research
vessels. Observer qualifications ranged from the deck hand with little
meteorological experience to the trained meteorologist. A detailed
quality control procedure was used to edit this conglomeration of
widely differing data.
Each report has been selectively checked for internal
consistency, extreme values, and legal codes. The results of the
editing process appear as quality indicators (flags) for each element
(or variable) checked. In general, if an element had already been
flagged and was flagged again, the flag indicating the greatest error
severity (i.e., with the largest numerical weight as defined in the
following) was retained; and a flagged element was not used in
determining if another variable should be flagged.* As an example,
if air temperature had been flagged as erroneous, then present weather
was not flagged because of that air temperature value. Any suspect or
erroneous data found were left unchanged and only flagged in this
quality control process, although some data corrections were made
beforehand (see supp. I and supp.
K).
The quality control subroutine (QC) is an important part of the
duplicate elimination program (described in supp. K)
because it provided a measure, in the form of a quality code, to judge which
report among duplicates was retained.** The quality code assigned
to each report is the sum of the weights associated with the 14 flags
given by Table J0-1, where the weight and the general meaning of each
possible flag value is given by Table J0-2.
It should be noted that the design of the QC will have to be
altered to handle observations starting in 1982, when again new coding
procedures were introduced.
_______________________
* NOTE: a report with ship position flagged erroneous (e.g.,
landlocked) was also subjected to all other possible checks, and thus
individual weather elements such as sea surface temperature may
contain an unreliable flag.
** A number of errors discovered in QC were corrected in subsequent
reprocessing of the data after duplicate elimination and completion of
the untrimmed data products. Thus some errors could have influenced
the selection of duplicates, and affect the untrimmed products to a
largely unknown extent (see supp. E). The description
given here describes the net effect of the QC that was originally performed
plus the corrections done afterwards, with a few minor exceptions such as
the following: 1) When negative dew point temperatures were recomputed
because of roundoff errors in Australian (deck 900) and HSST Exchange
(decks 155-156) data, side-effects on flags were minimized by not
completing recomputation unless the new dew point was exactly 0.1°C
colder than the old one. One possible side-effect is that the L and Q
flags, for data outside long-term climatological limits  ± 4.8σ and ±
5.8σ, may no longer be strictly correct. 2) During corrections in
which wind direction was temporarily substituted into a missing wave direction,
wave fields (direction, period, and height) containing erroneous
characters were treated as if they were missing, but would not be
treated as such with a revised QC.
± 4.8σ and ±
5.8σ, may no longer be strictly correct. 2) During corrections in
which wind direction was temporarily substituted into a missing wave direction,
wave fields (direction, period, and height) containing erroneous
characters were treated as if they were missing, but would not be
treated as such with a revised QC.
_______________________
Table J0-1
Possible QC Flag Values
-------------------------------------------------------------------
                                     Possible flag values (X)
                            ---------------------------------------
Abbrev.  Flag              | R | A   B | J   K   L | M   N   Q   S
---------------------------|---|-------|-----------|---------------
shipf    ship position     | X |       |     *     | X
windf    wind              | X | X     | X         | X       X   X
visf     visibility        | X |       |           | X           X
prswxf   present weather   | X |     X | X       X | X           X
pstwxf   past weather      | X |       | X         | X           X
pressf   pressure          | X |       |     *   X | X       X   X
dryf     air temp.         | X |       | X   *   X | X   X   X   X
wetf     wet bulb temp.    | X |     X |     *   X | X   X   X   X
dewf     dew point temp.   | X |     X |     *   X | X   X   X   X
seaf     sea surface temp. | X |       |     *   X | X       X   X
cloudf   cloud             | X | *   X | X         |     X       X
seawvf   wave              | X | X   X | X         | X   X   X   X
swlwvf   swell             | X |     X | X         | X   X   X   X
ptendf   pressure tendency | X |       |     X     | X           X
-------------------------------------------------------------------

* Additional possible flag values in TD-1129 for data in the
period 1970-1979 because of flag overlaying (see sec. 1).
_____________________
Table J0-2
QC Flag Meaning
Value*  Coded**  Weight    Meaning      Reason
----------------------------------------------------------------------
  R       1        0       correct      --
  A       2        1       correctable  legality
  B       3        1       correctable  internal consistency
  J       4        2       suspect      internal consistency
  K       5        2       suspect      time
  L       6        2       suspect      extreme (outside  ± 4.8 σ)
  M       7        3       erroneous    legality
  N       8        3       erroneous    internal consistency
  Q       9        3       erroneous    extreme (outside  ± 5.8 σ)
  S      10        3       missing      --
----------------------------------------------------------------------

* Alphabetic representation in TD-1129(M).
** Numeric representation in LMR (see supp. F).
_________________________
1. Effects of Previous Quality Control
For data in the period 1970-1979, at least the '70s Decade data
set (source ID 18) had been previously quality controlled by NCDC
using a process similar to that described here. In the later years
(from May 1973 on) when individual ships could be identified, some
track checks were conducted for unbroken series of reports (i.e., when
the interval between reports was less than 24 hours). Table J1-1
describes the procedure used.
Table J1-1
Previous '70s Decade Track Checks
------------------------------------------------------------------------------------
1) Ship position flag set to K if either an applicable limit on change in longitude,
depending on latitude position, or the limit on change in latitude are exceeded:
         ----------------------------------------------
          Longitude change                  Latitude
         limit (degree/hour)              position (X)
         ----------------------------------------------
                0.7                      0 ≤ |X| ≤ 39.9
                1.0                     40 ≤ |X| ≤ 49.9
                1.4                     50 ≤ |X| ≤ 59.9
                2.0                     60 ≤ |X| ≤ 69.9
                2.7                     70 ≤ |X| ≤ 75.0
         ----------------------------------------------
           Latitude change
         limit (degree/hour)
                0.7
         ----------------------------------------------

2) Ship position flag set to K in two or more reports with the same call sign and
same time but different positions.  If the ship positions are within 0.5° in both
latitude and longitude, change the flag to C for a report with the lowest quality
code (ties are handled by the arbitrary selection of one report to receive the C).

3) The following individual elements are flagged K if they show a change greater
than the indicated value:
         ----------------------------------------------
         sea level pressure                   5 mb/hour
         air temperature                      5°C/hour
         dew point/wet bulb temperature       5°C/hour
         sea surface temperature              3°C/hour
------------------------------------------------------------------------------------
Also,it should be noted that a few elements flagged "correctable"
by the previous '70s Decade quality control were slightly modified at
that time and carried forward. Otherwise the practice at NCDC,
starting with data observed in 1970, has been to leave suspect or
erroneous data unchanged.
Both the new and old sets of flags are available in LMR, but
there is room for only one set of flags in TD-1129. Therefore, the two
sets of flags were overlaid in TD-1129 as given in supp.
I.
Prior to the 1970-79 period, the data came mostly from the Atlas
(source ID 1), which had also been through an earlier editing process
where some elements had been changed or eliminated during the quality
control, including some creation of composite reports.* For most
Atlas data, the flags assigned in the latest quality control will either be
an S (missing) or an R (accepted as a valid element), as most of the
inconsistencies were corrected during that first edit.
_______________________
* See supp. K for details on a few similar
substitutions between different reports that were carried out in duplicate
elimination.
_______________________
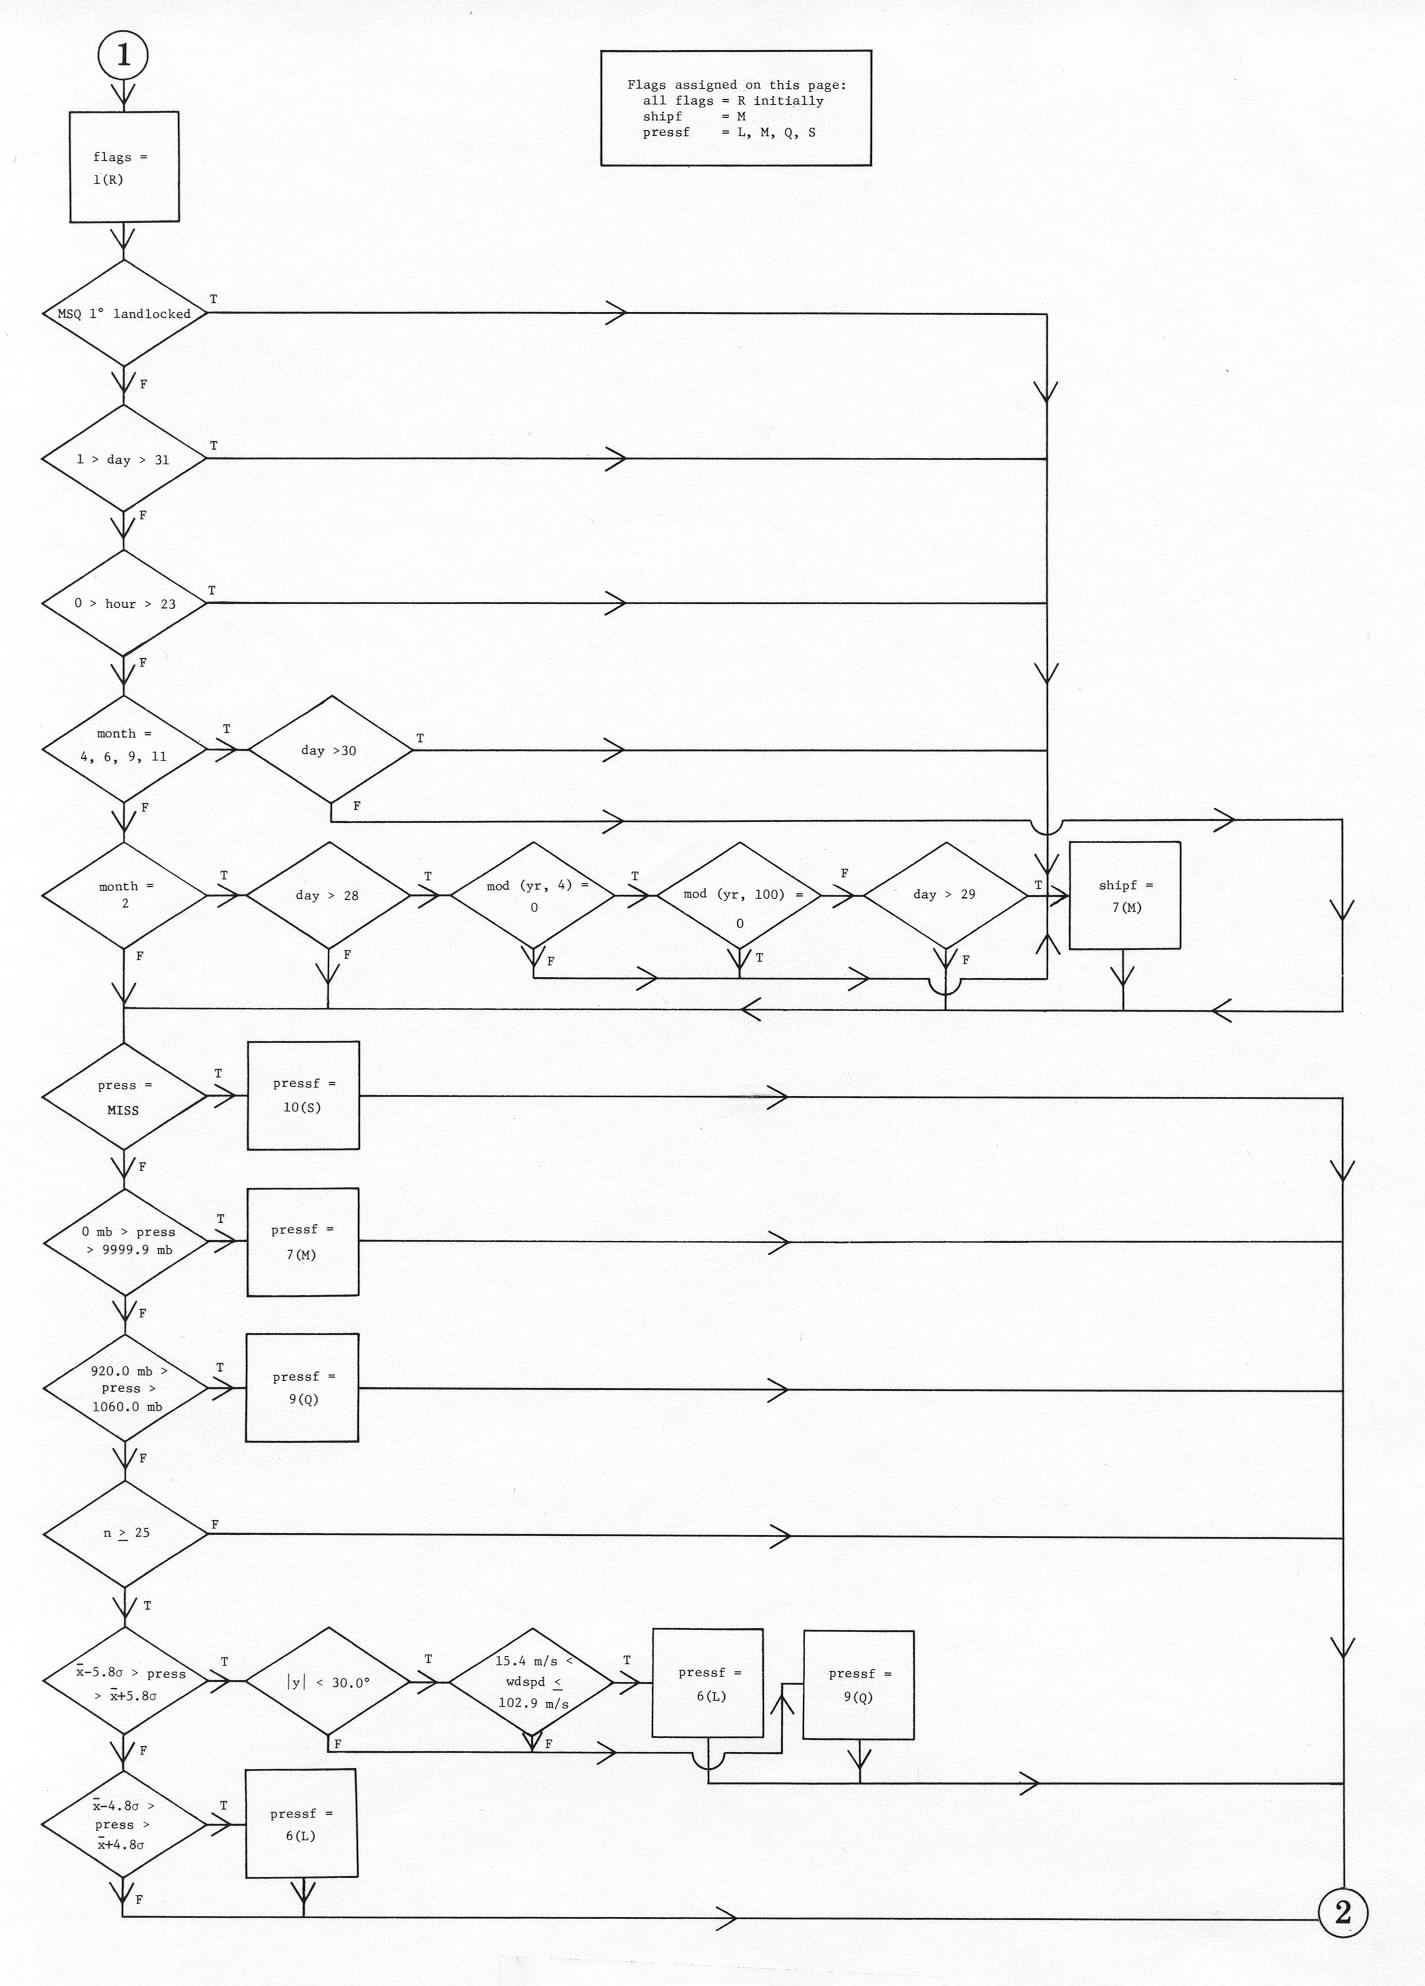
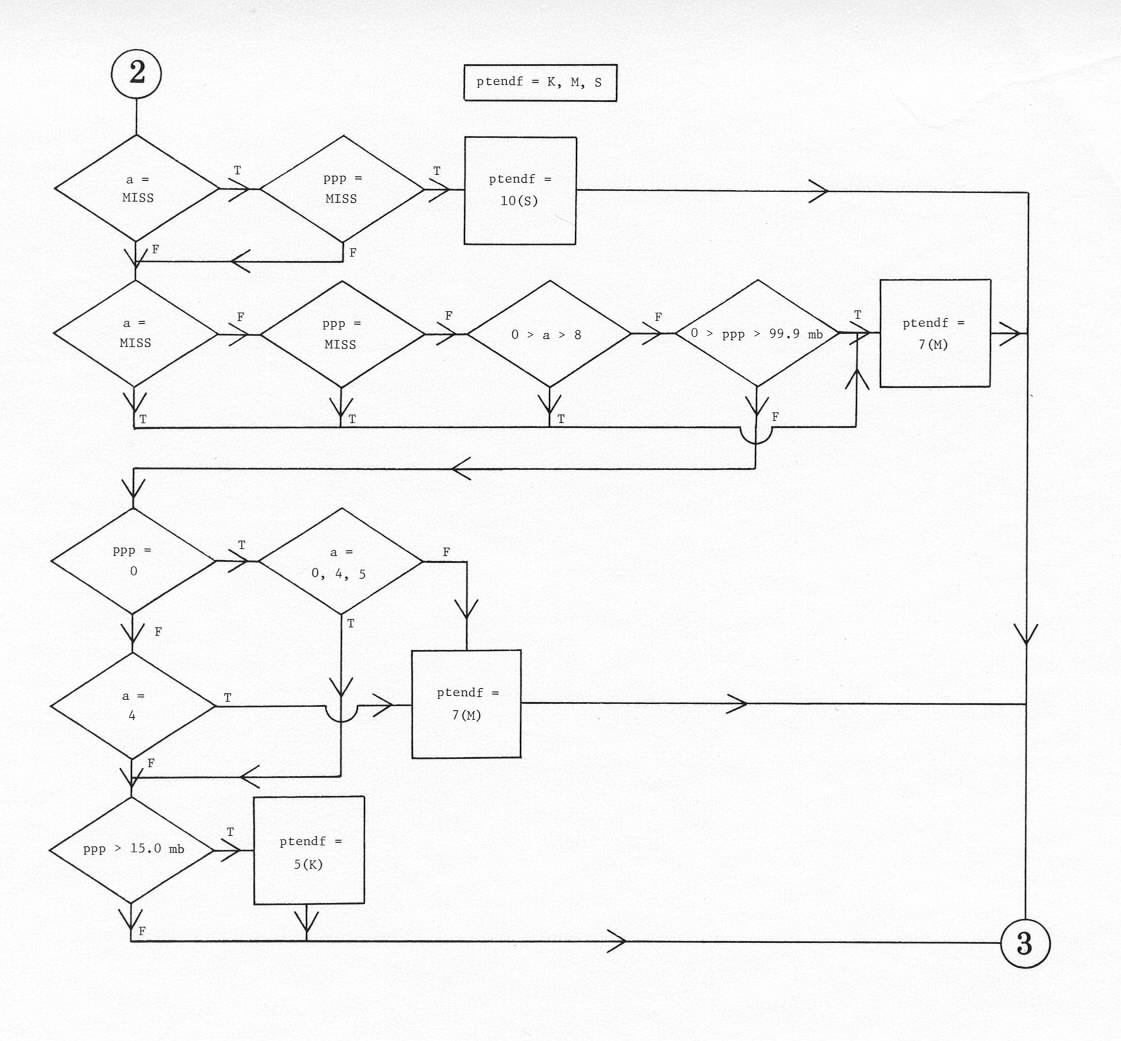
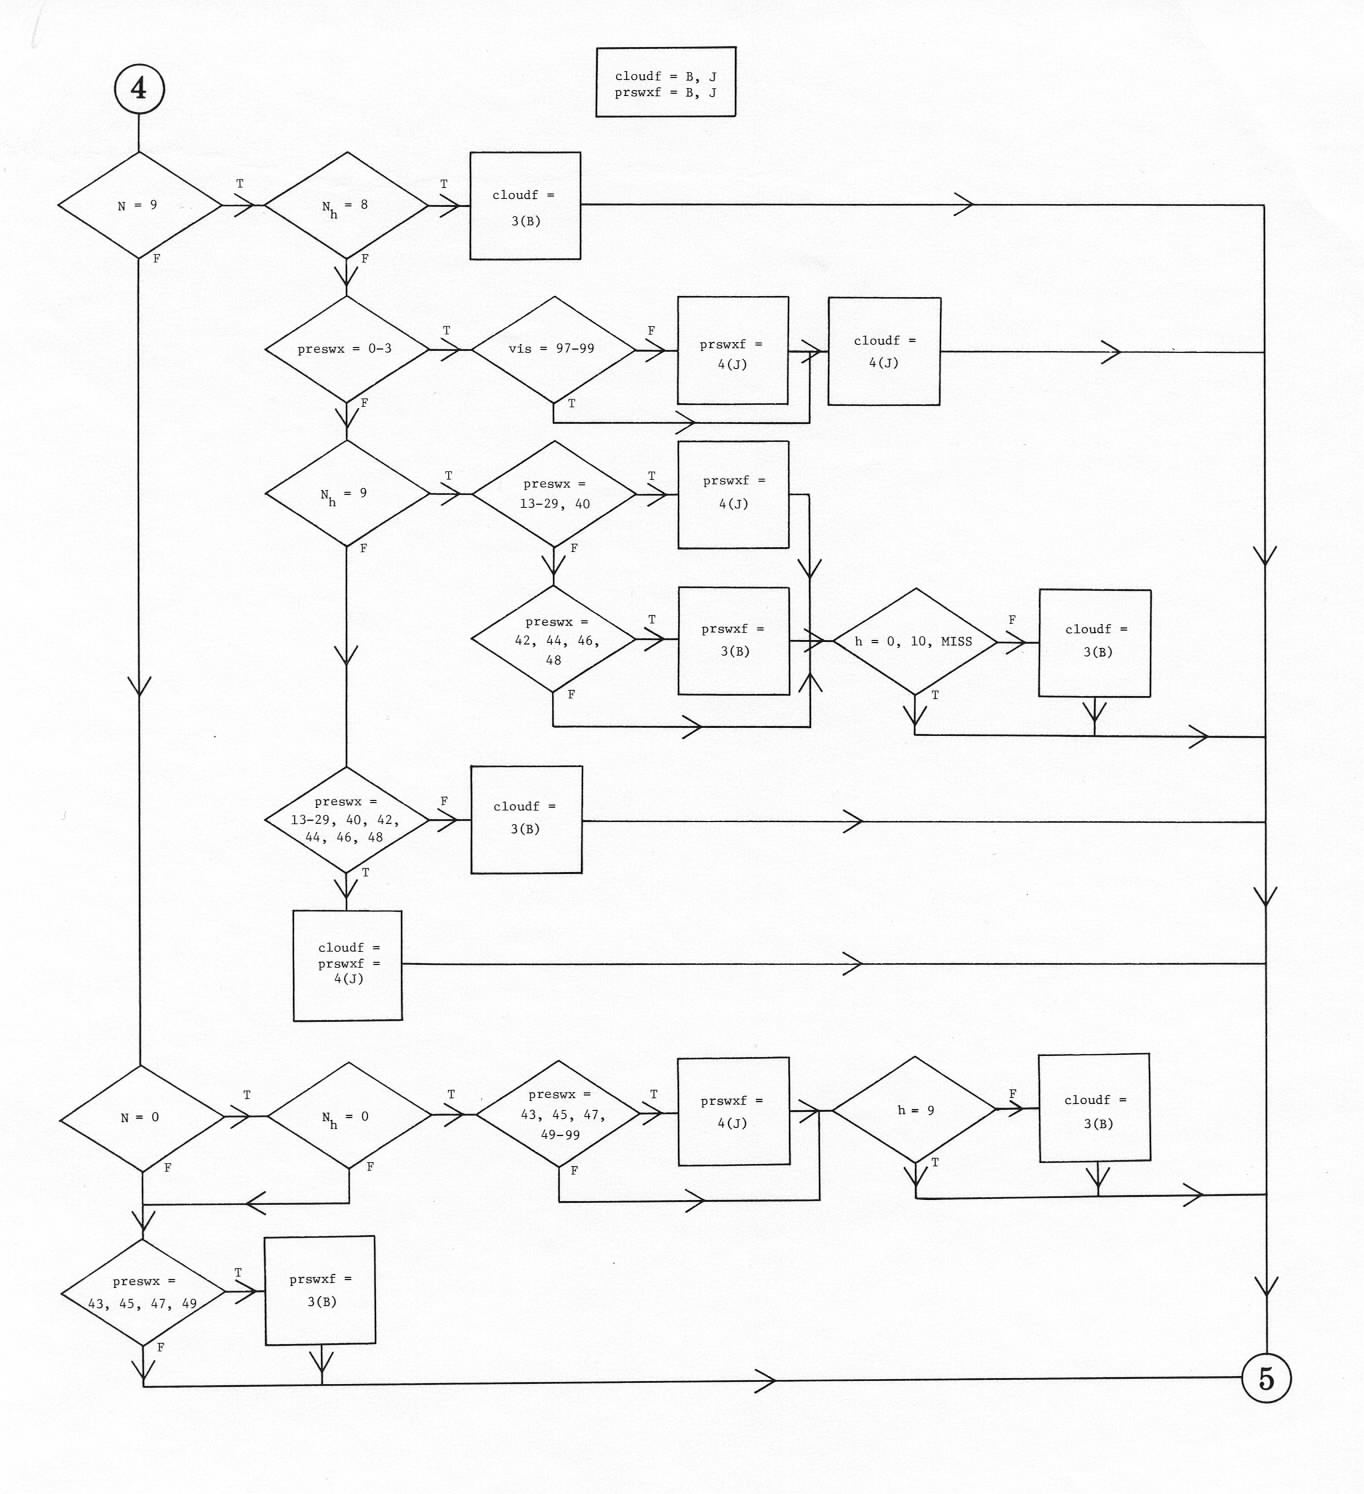
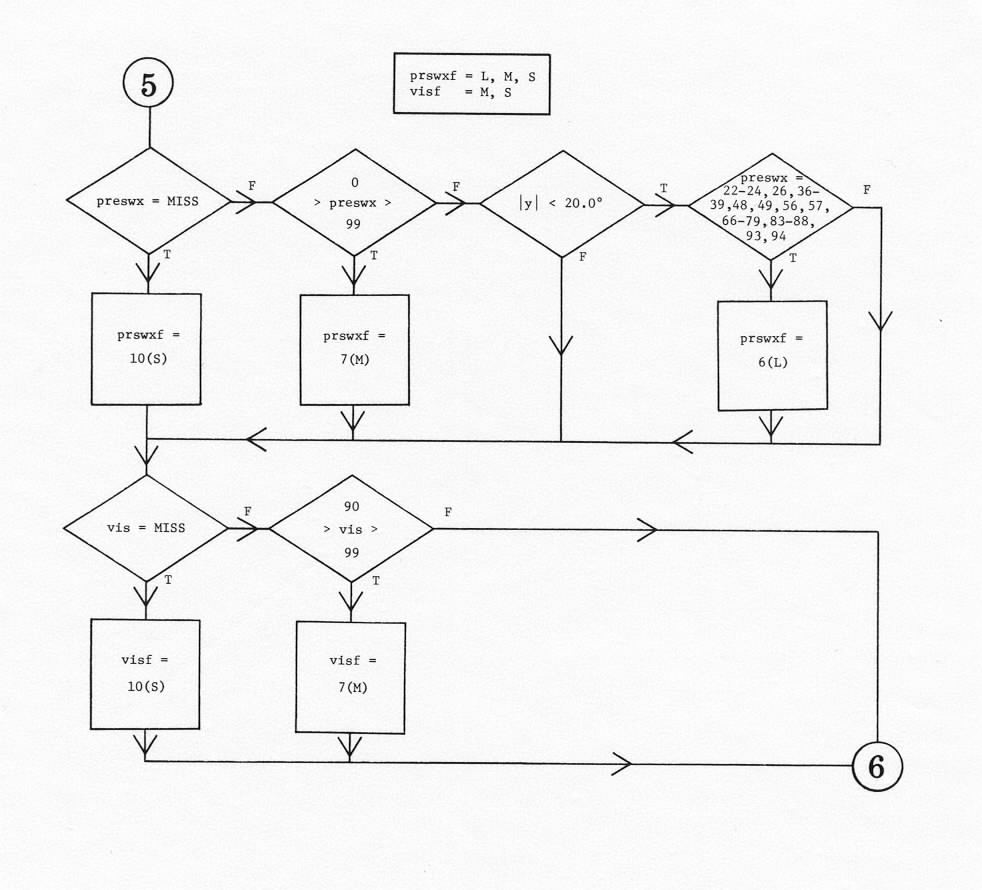
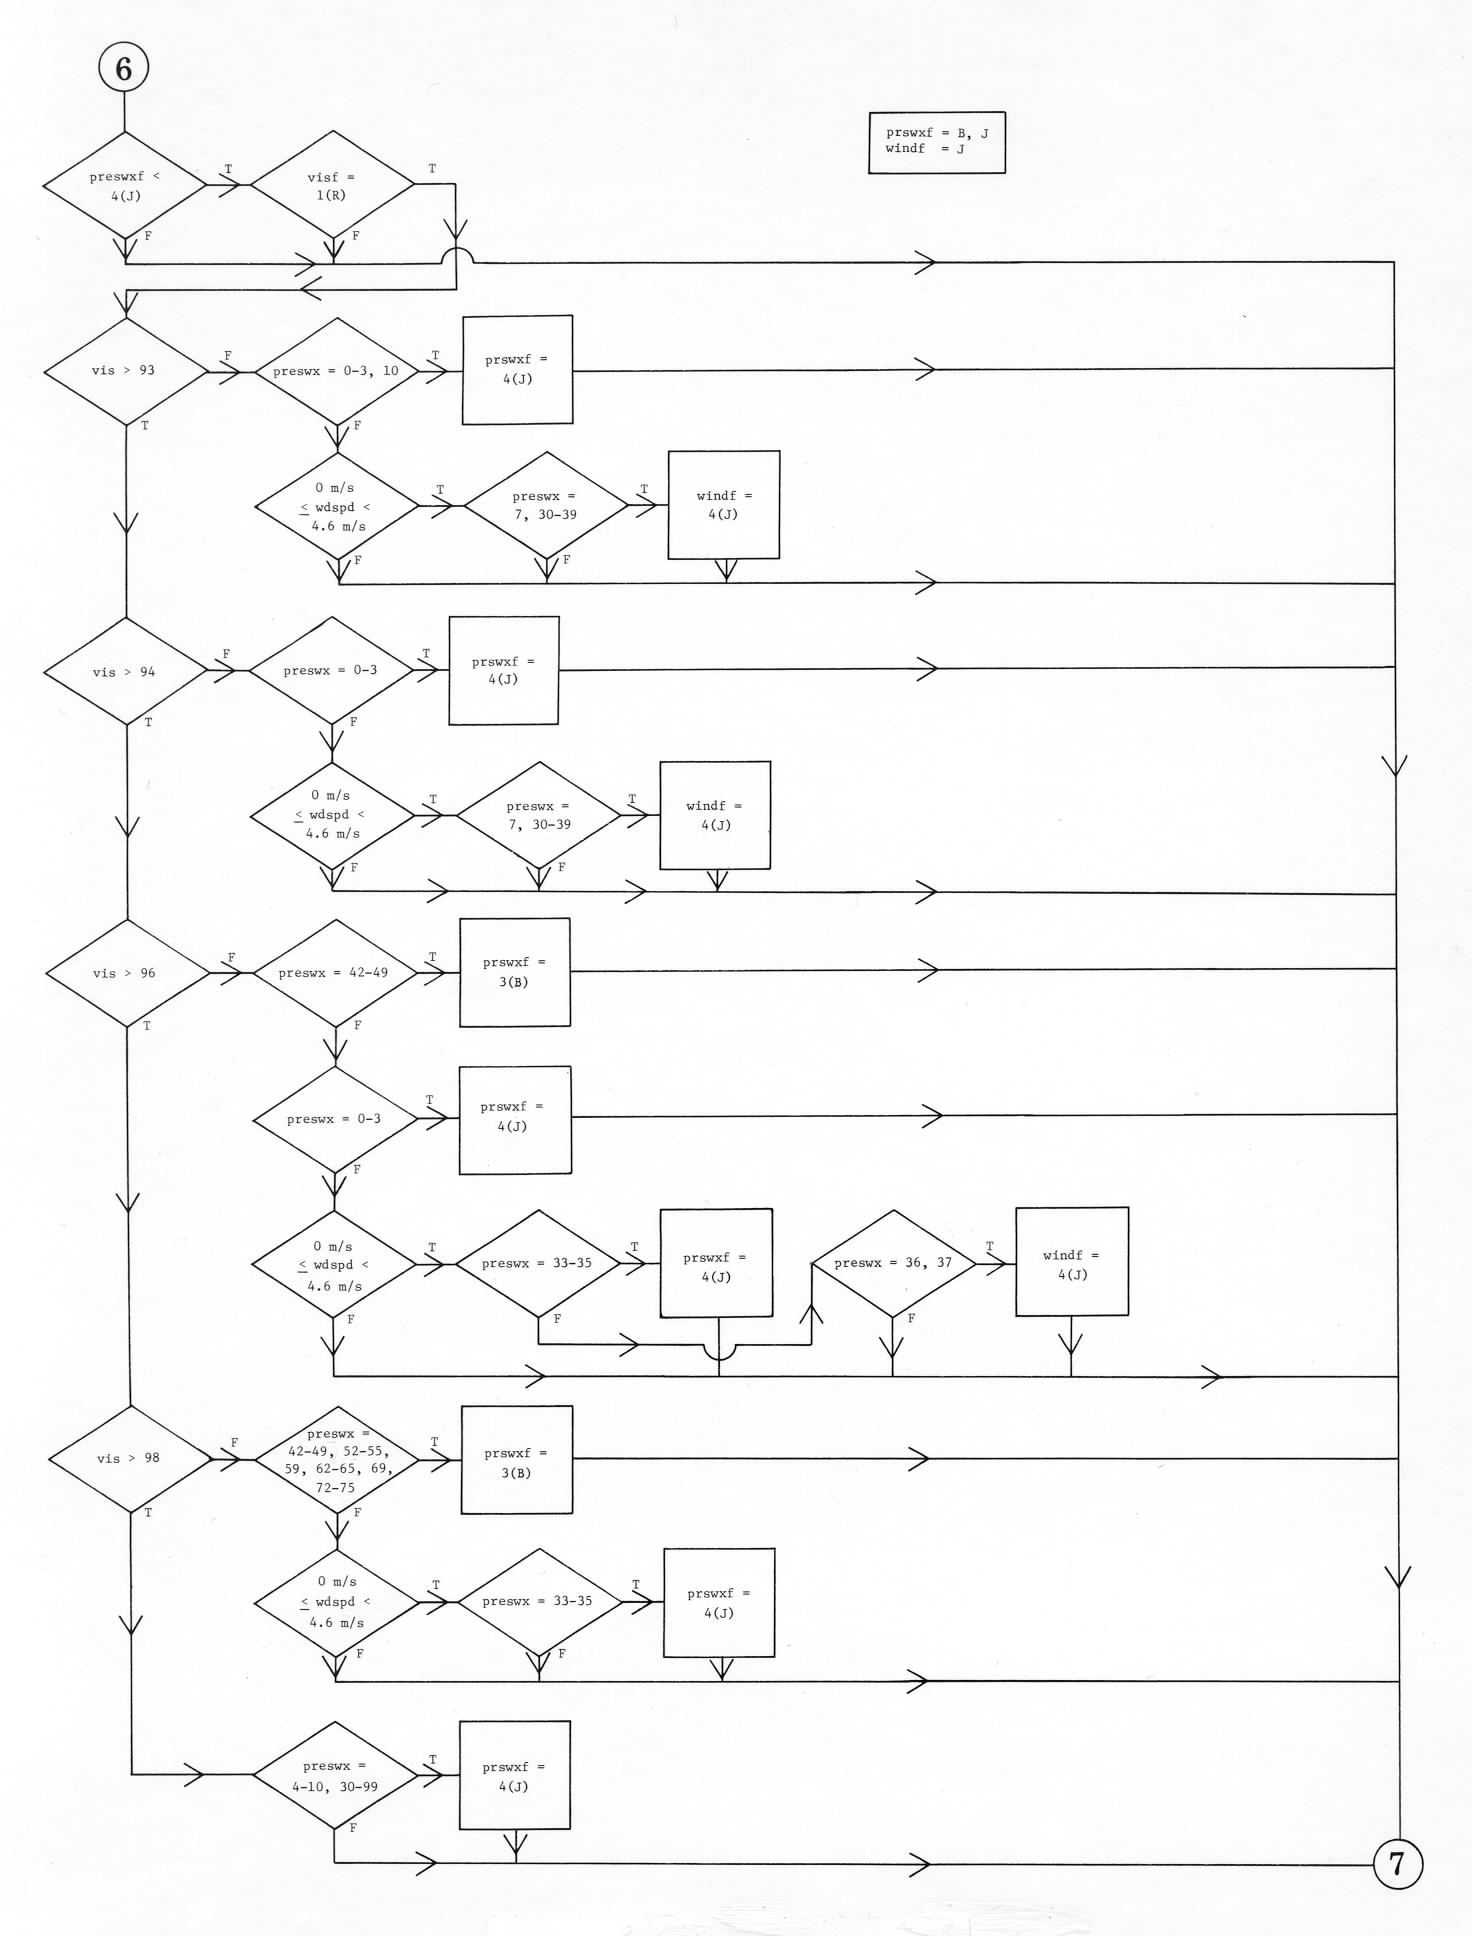
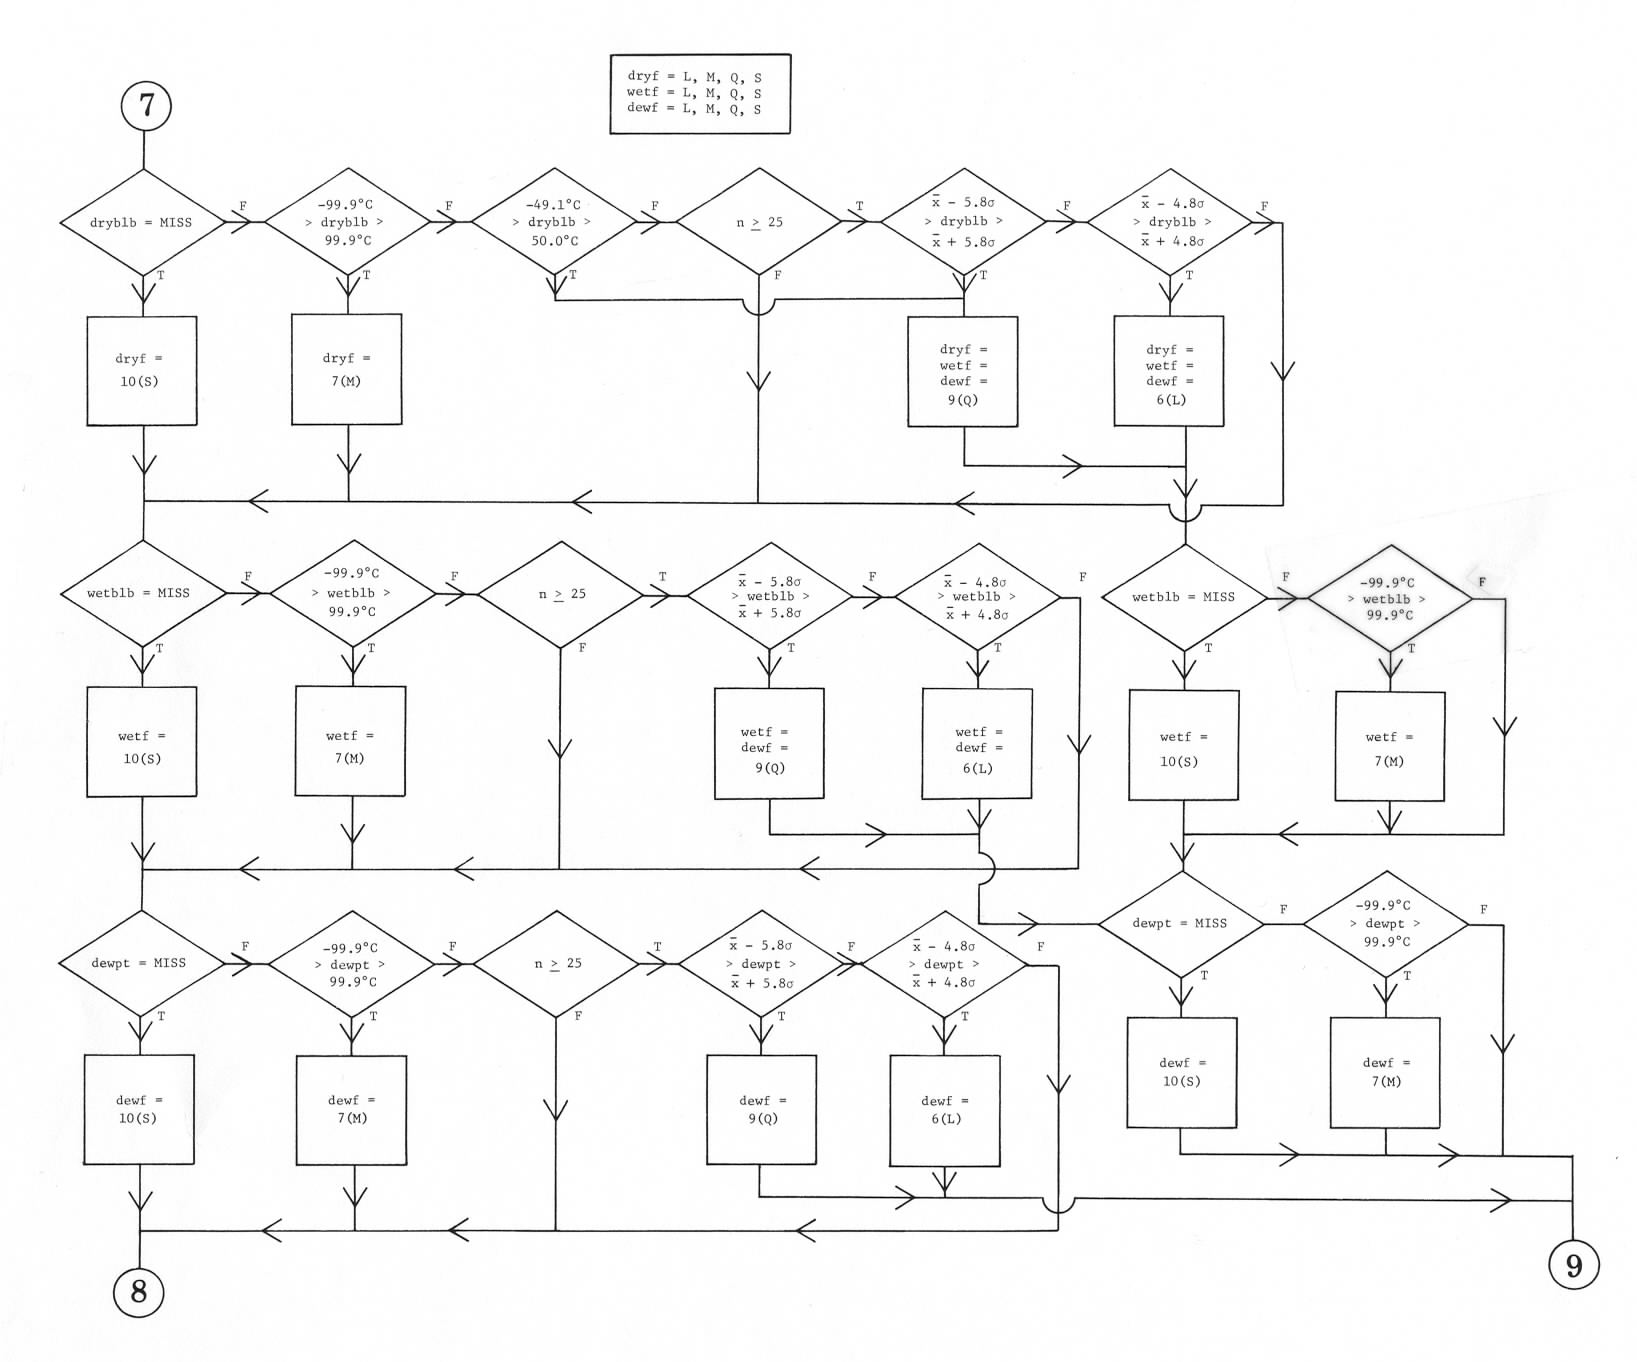
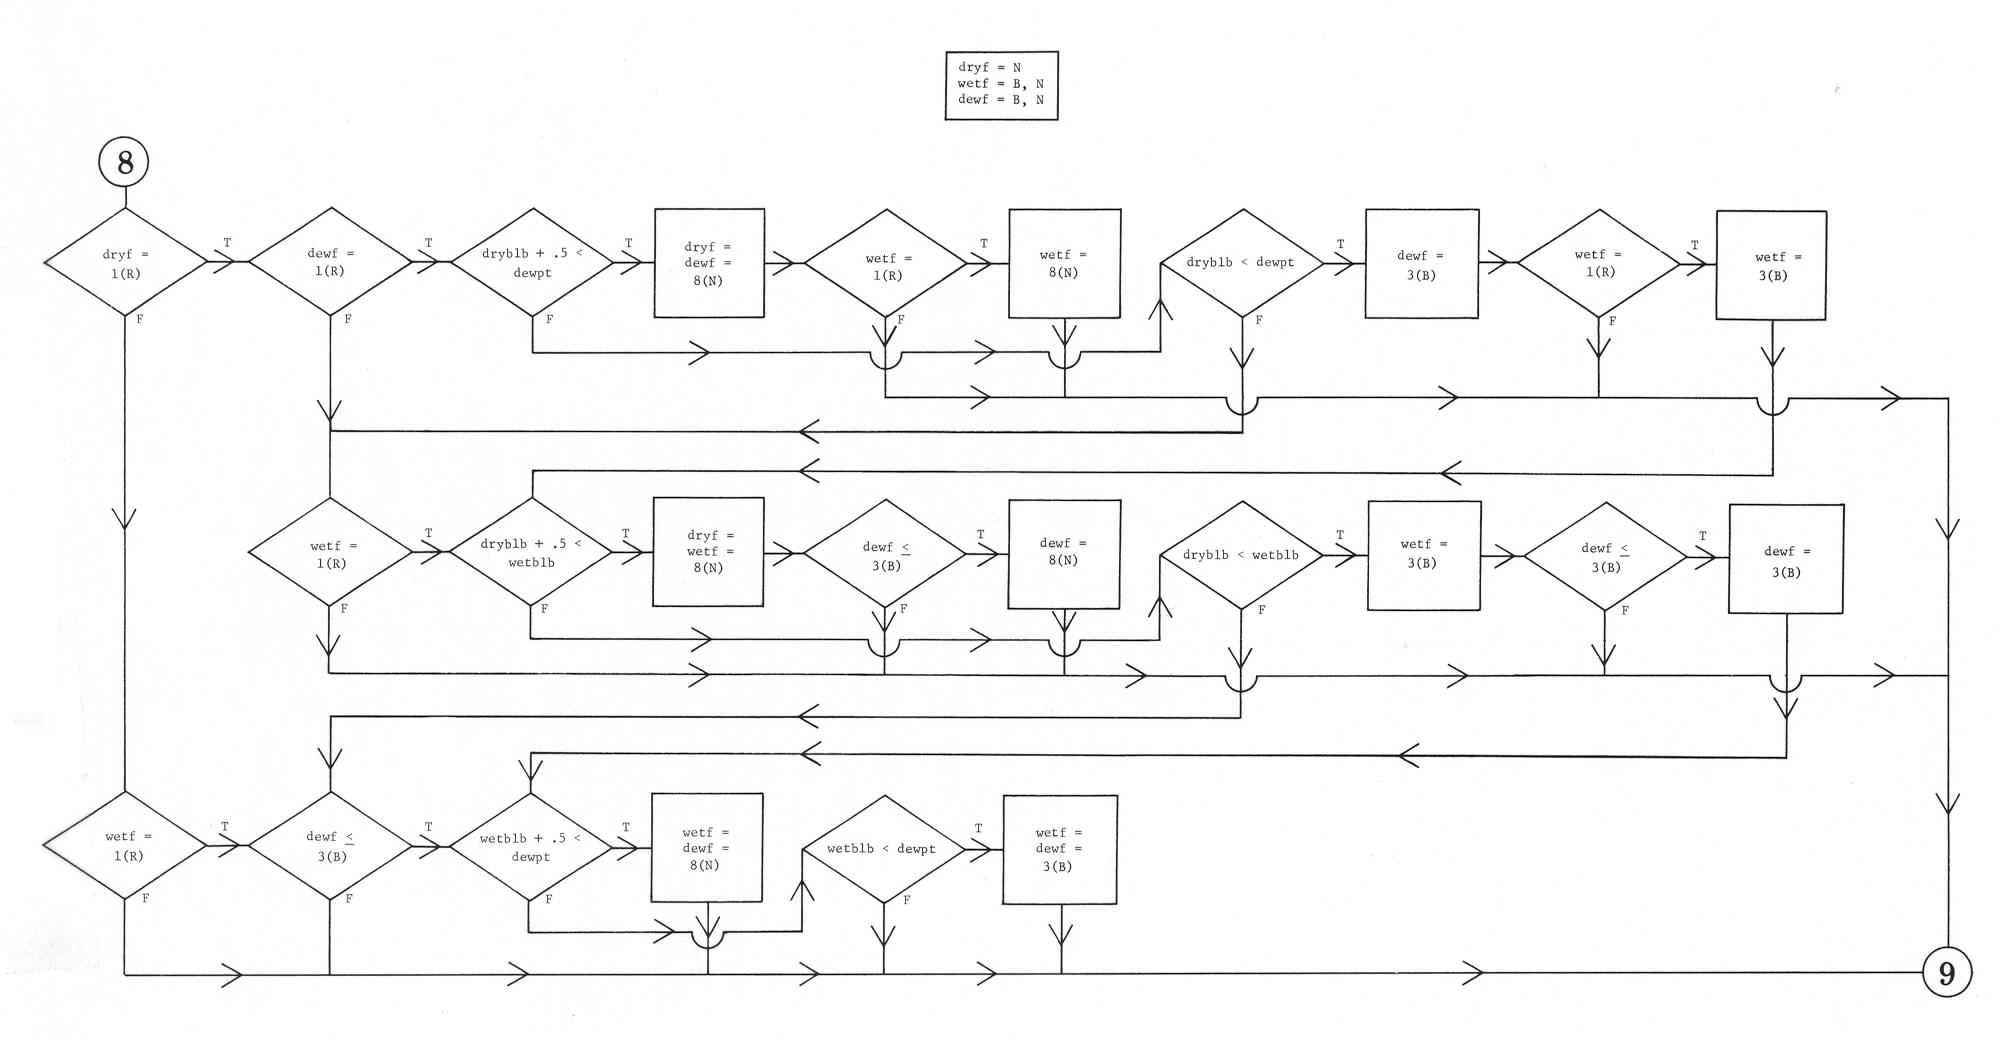
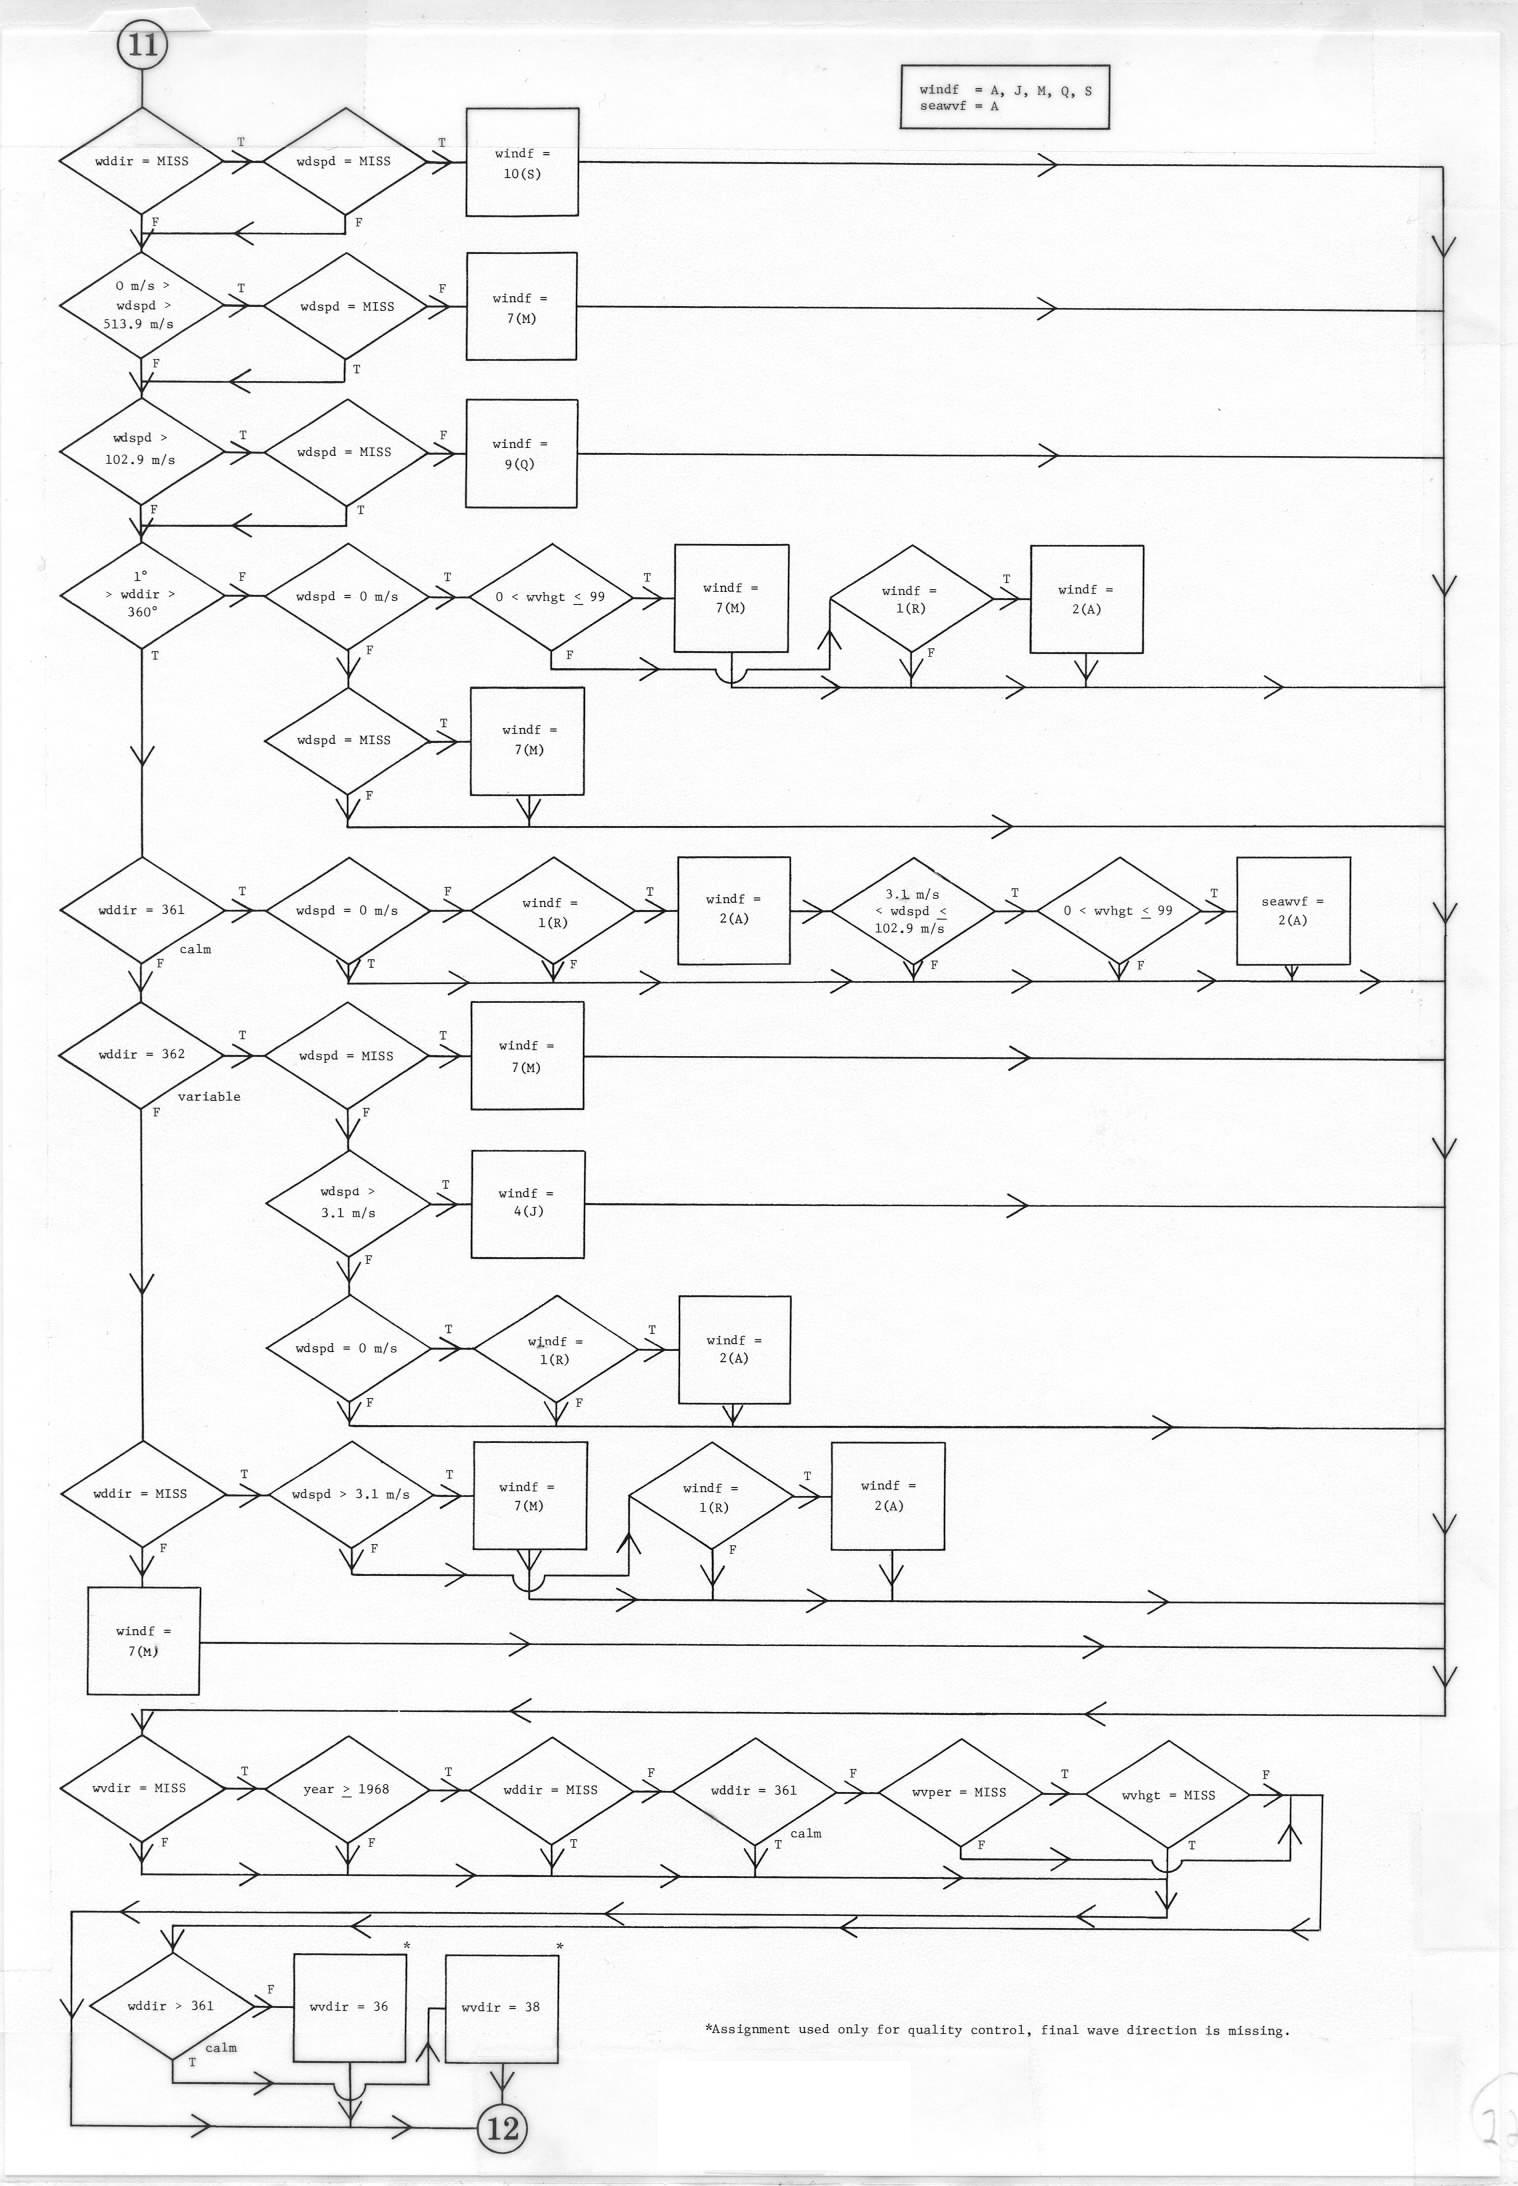
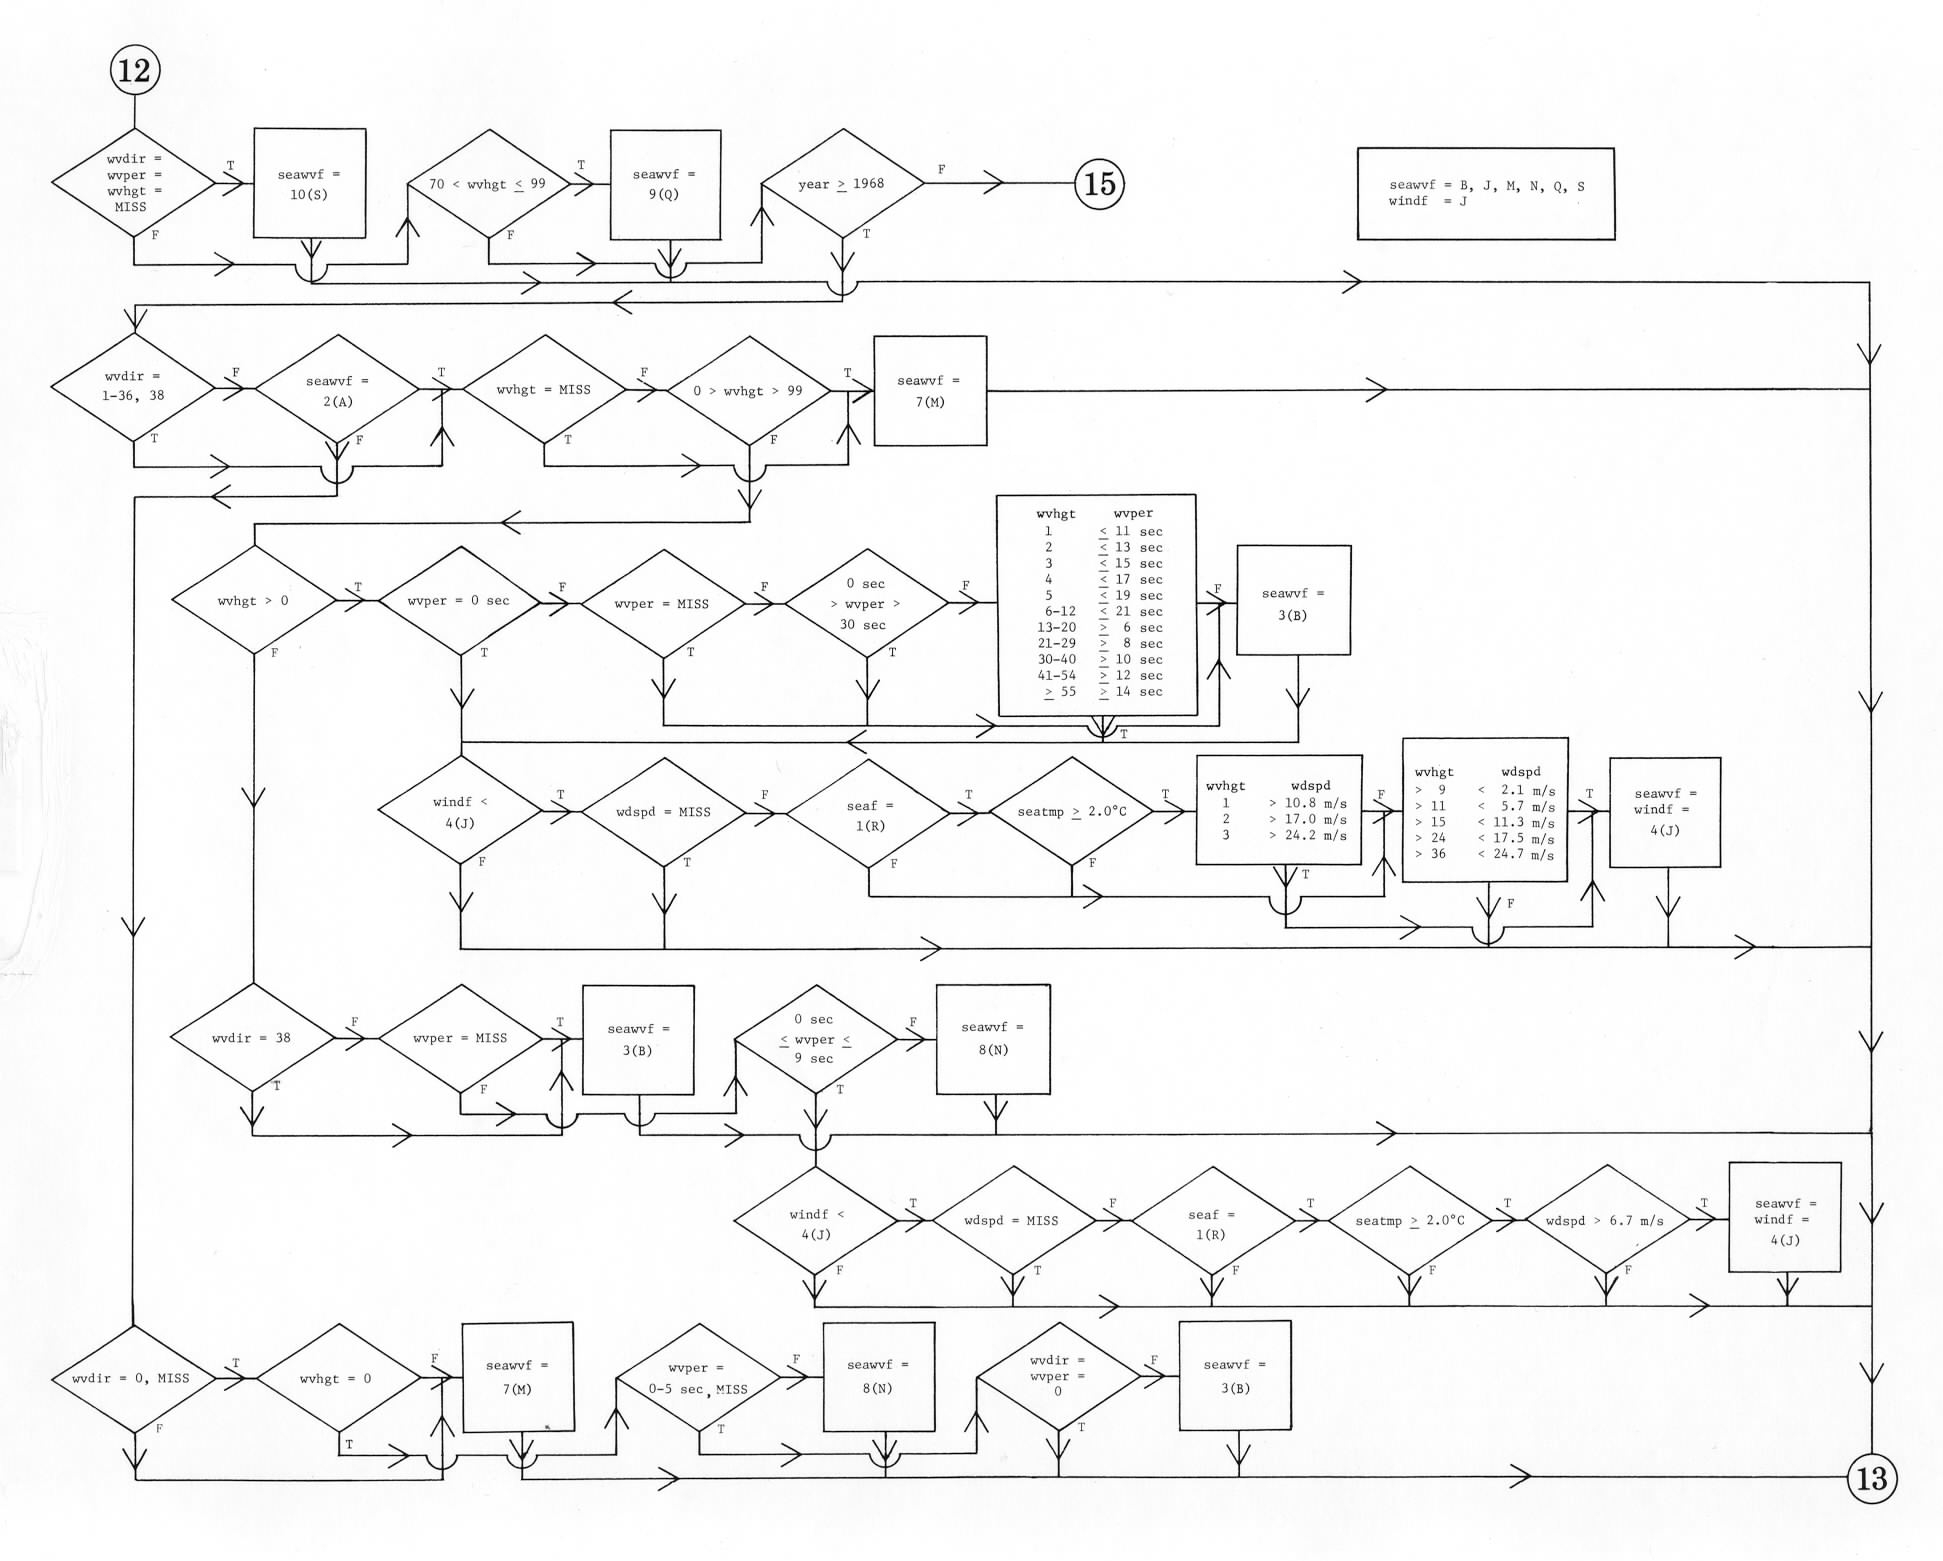
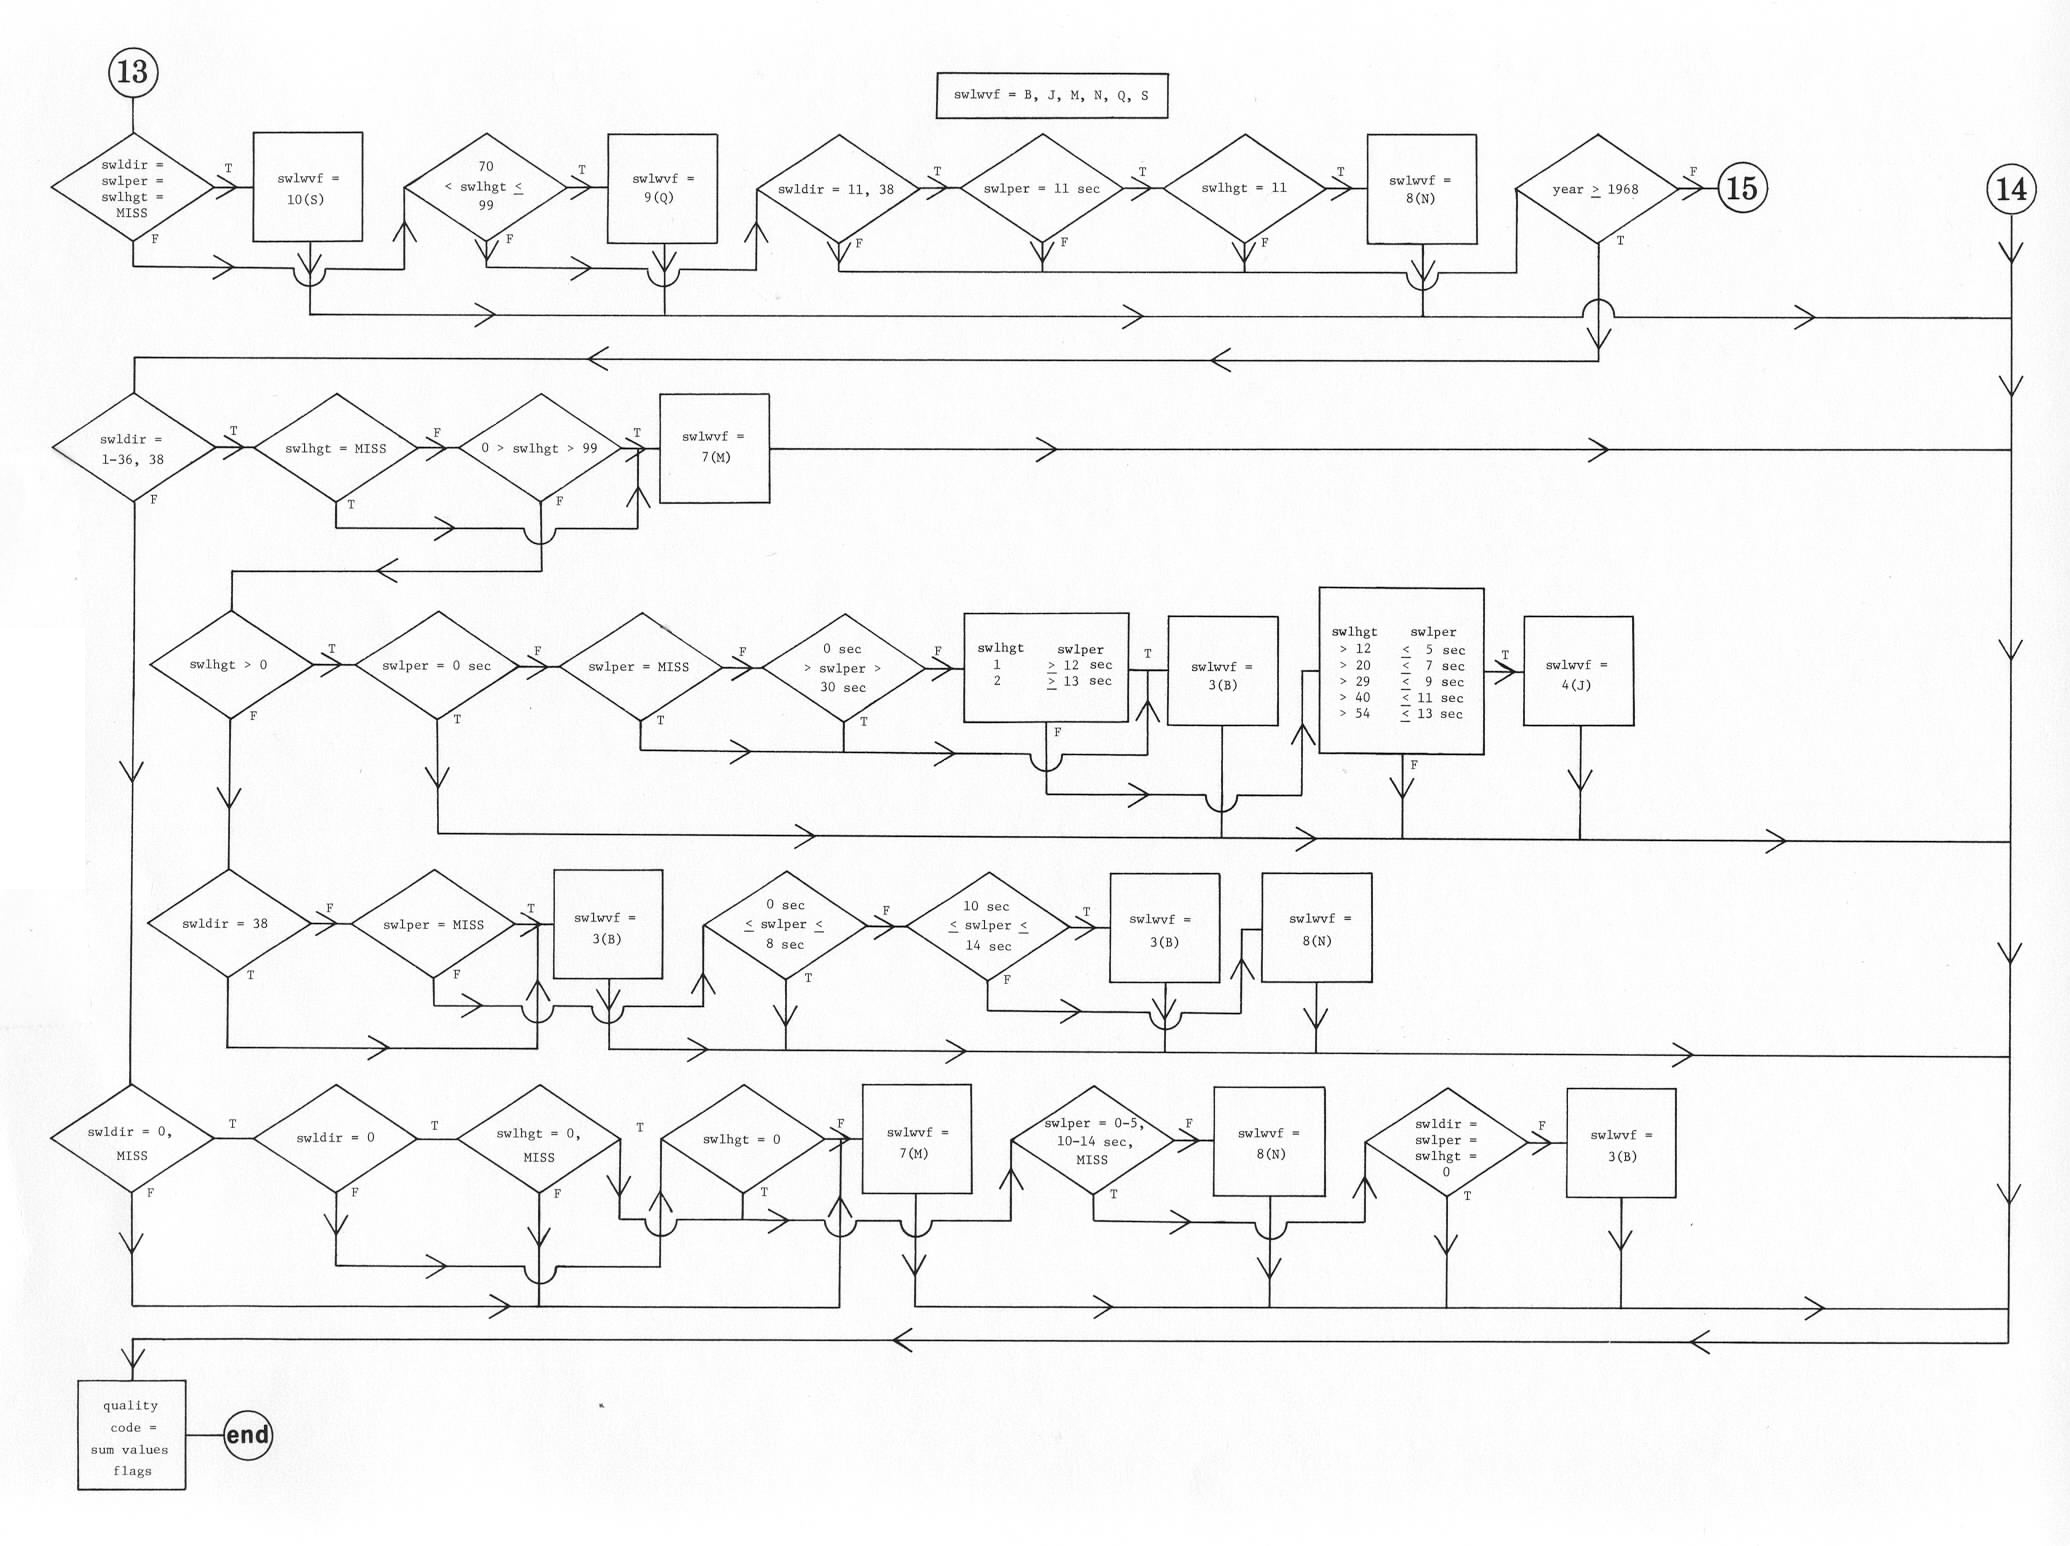
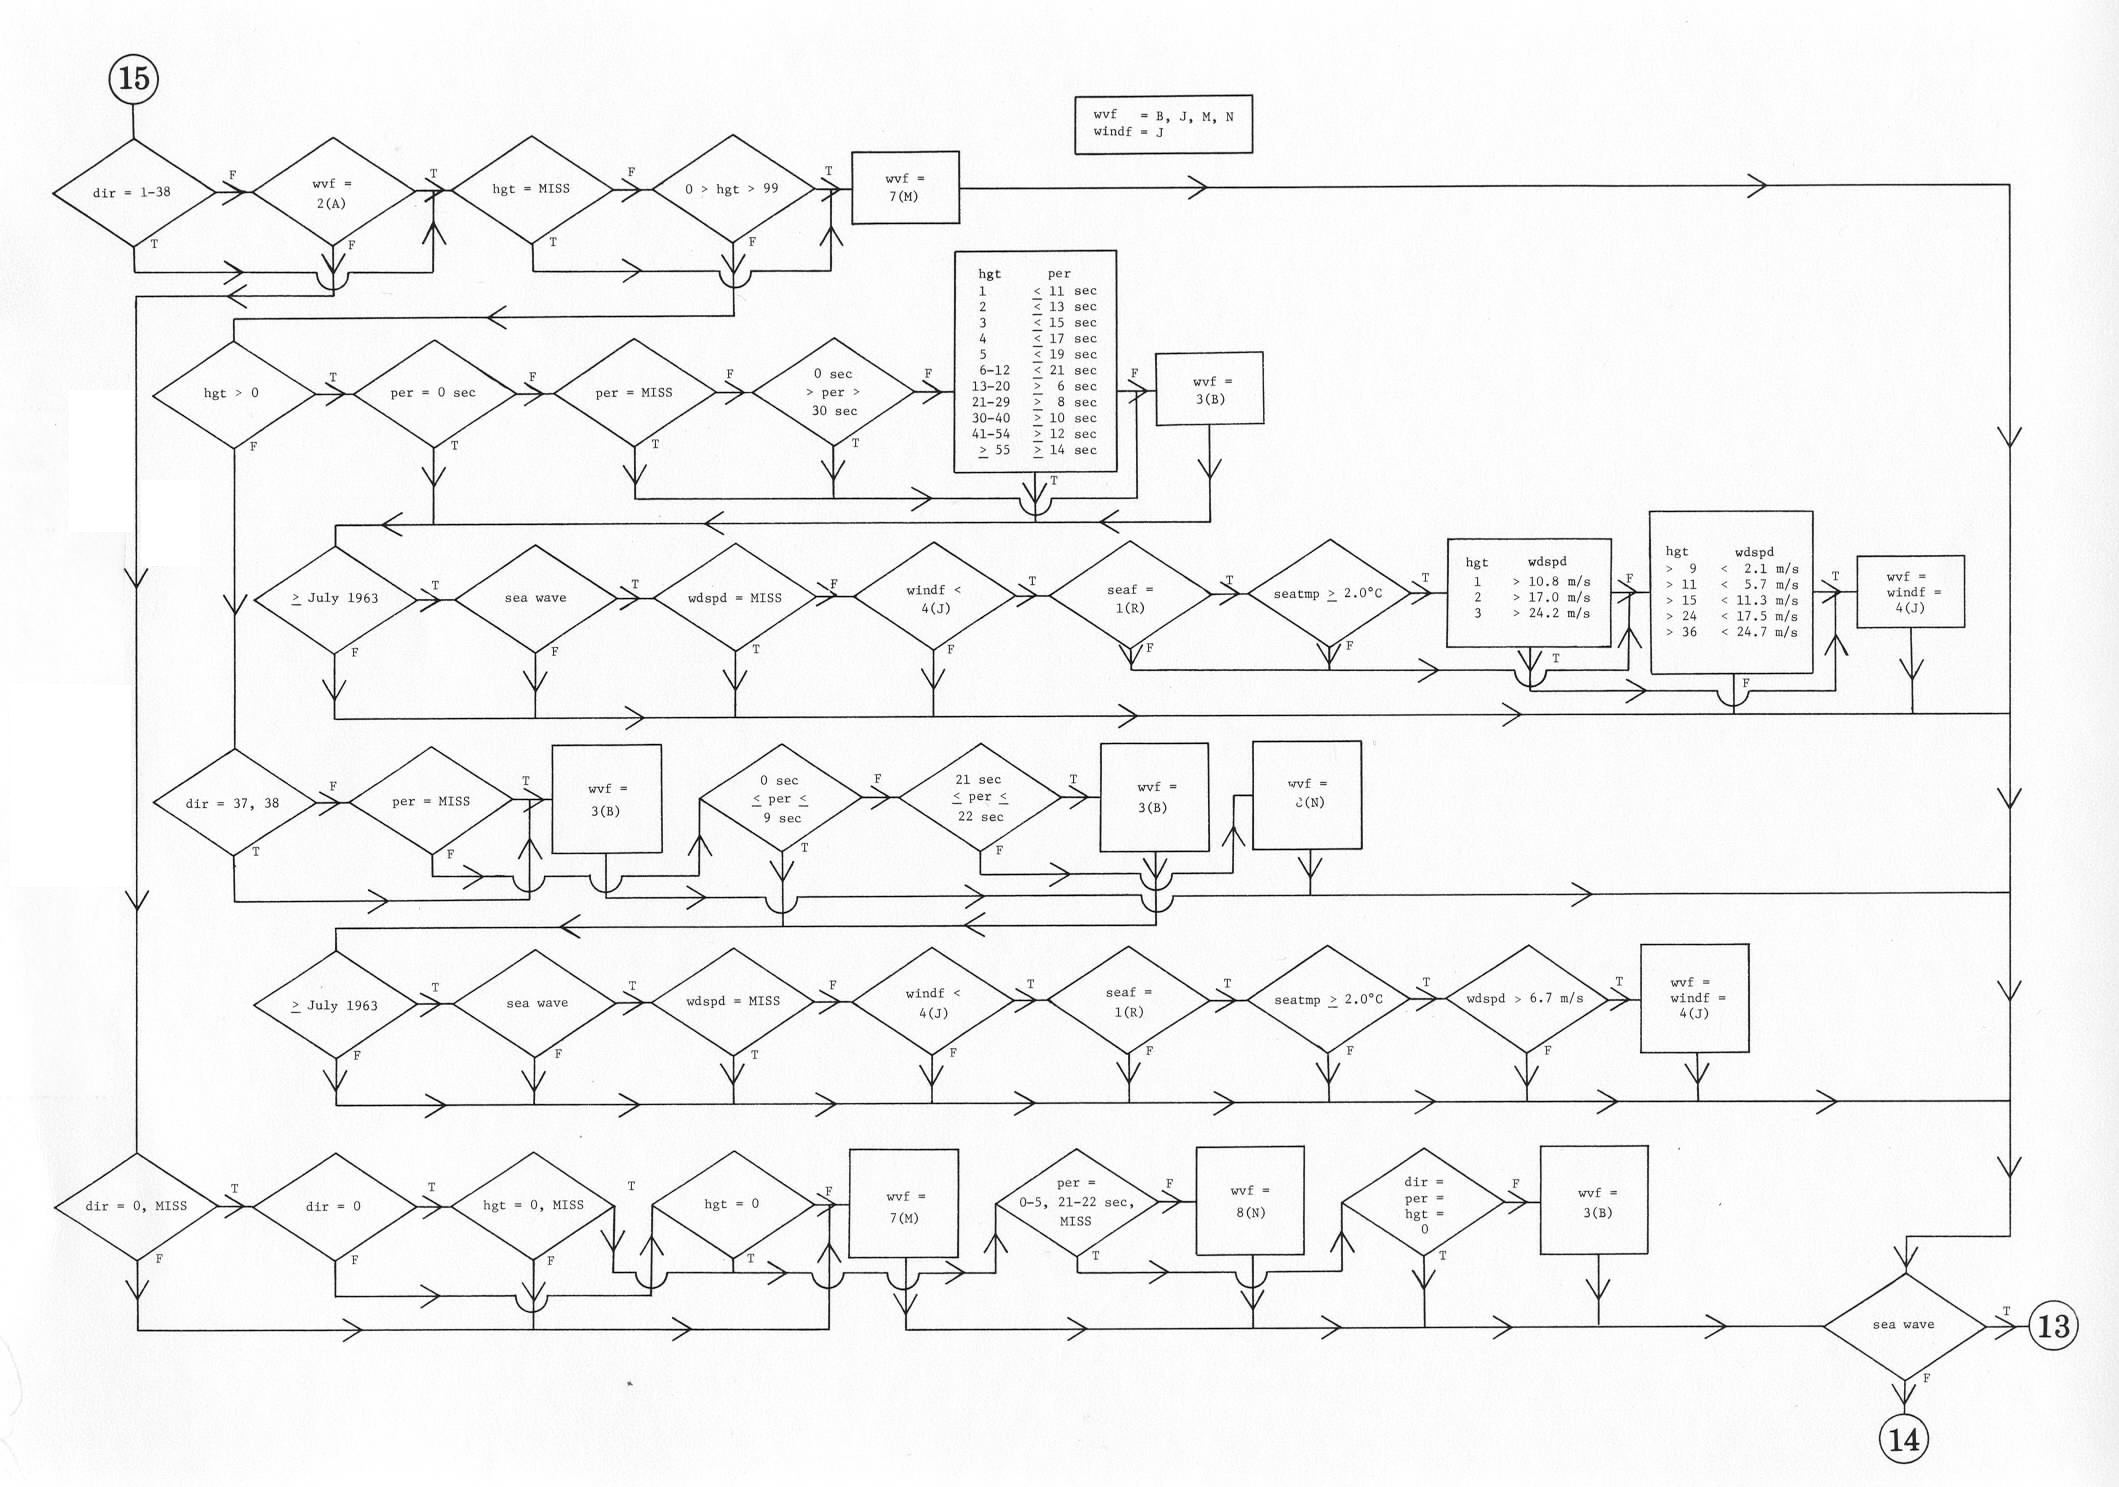
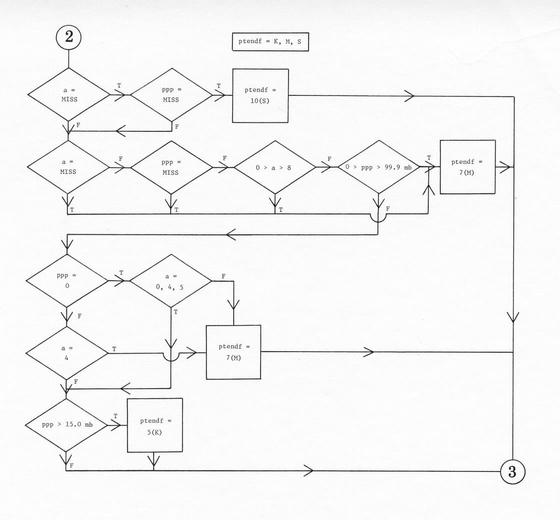
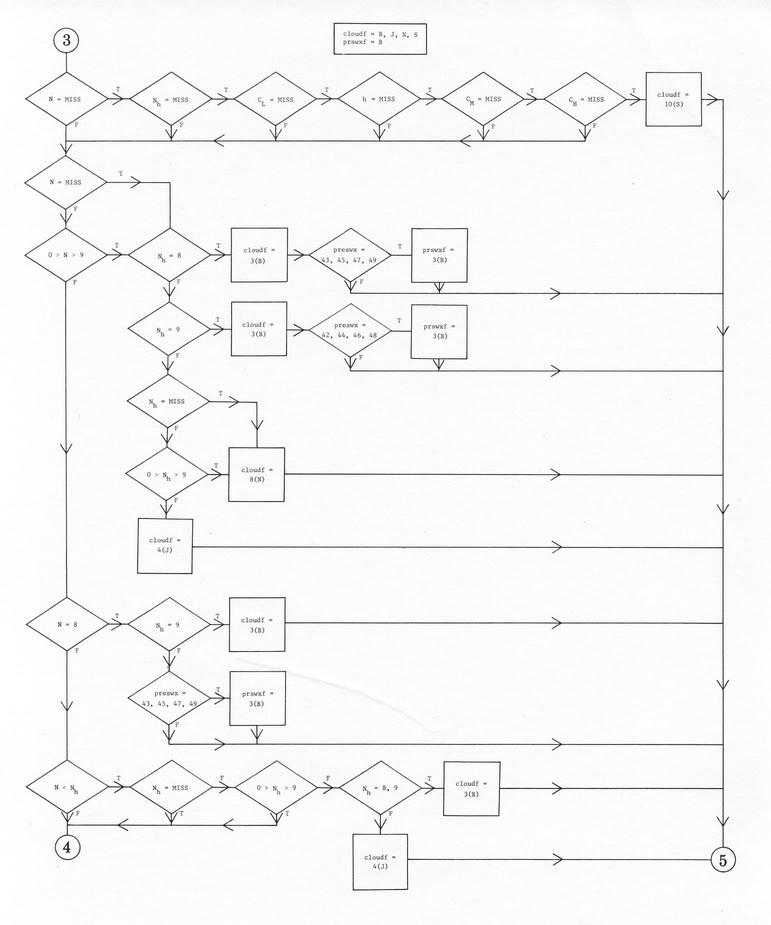
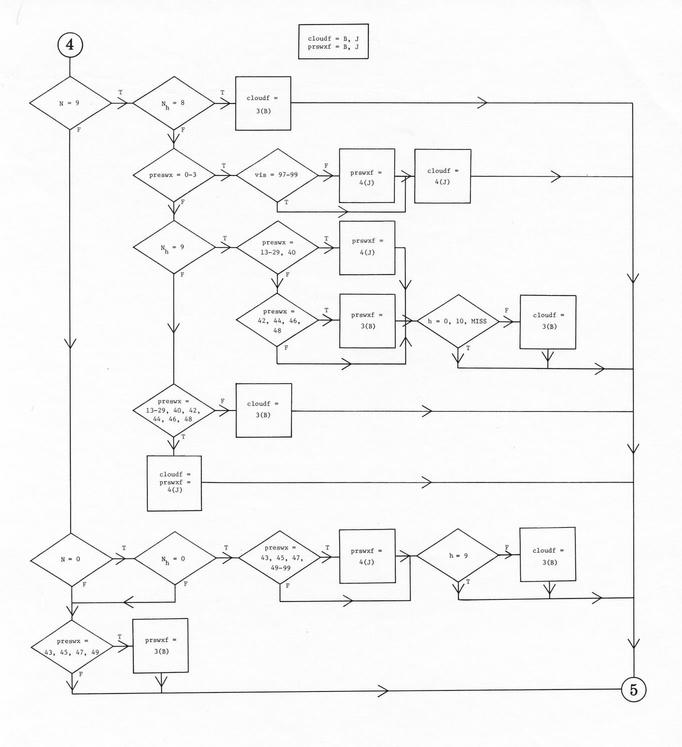
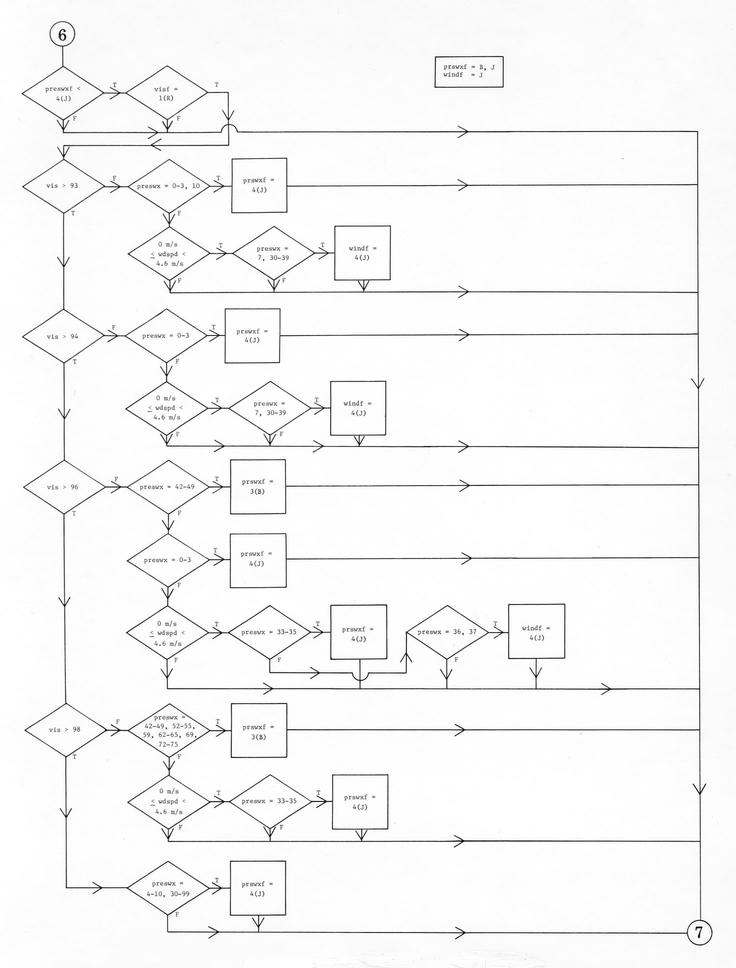
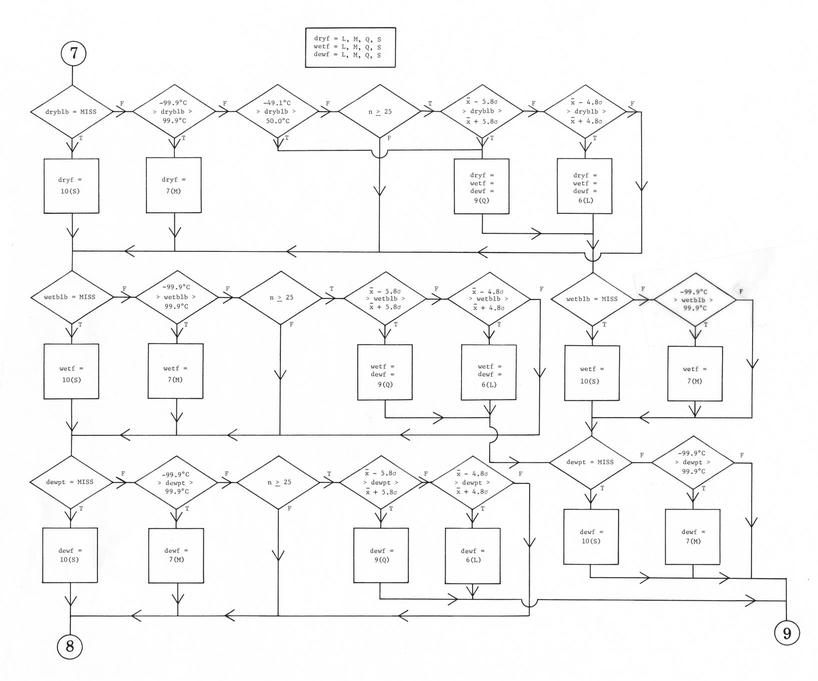
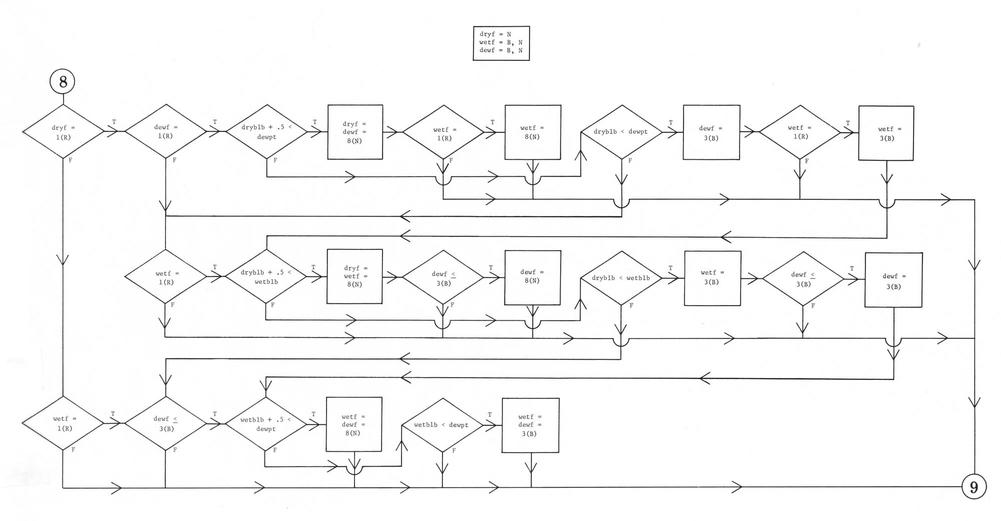
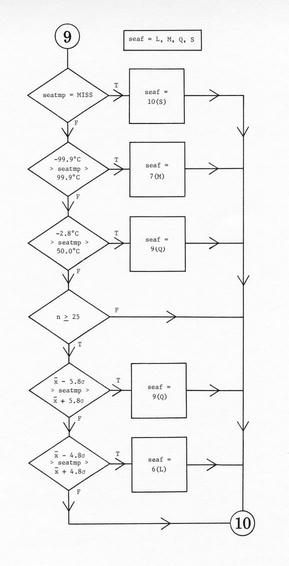
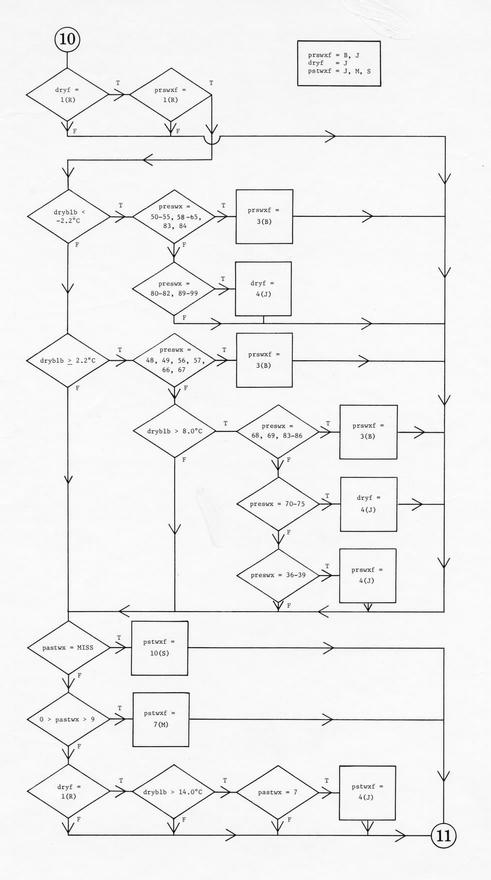
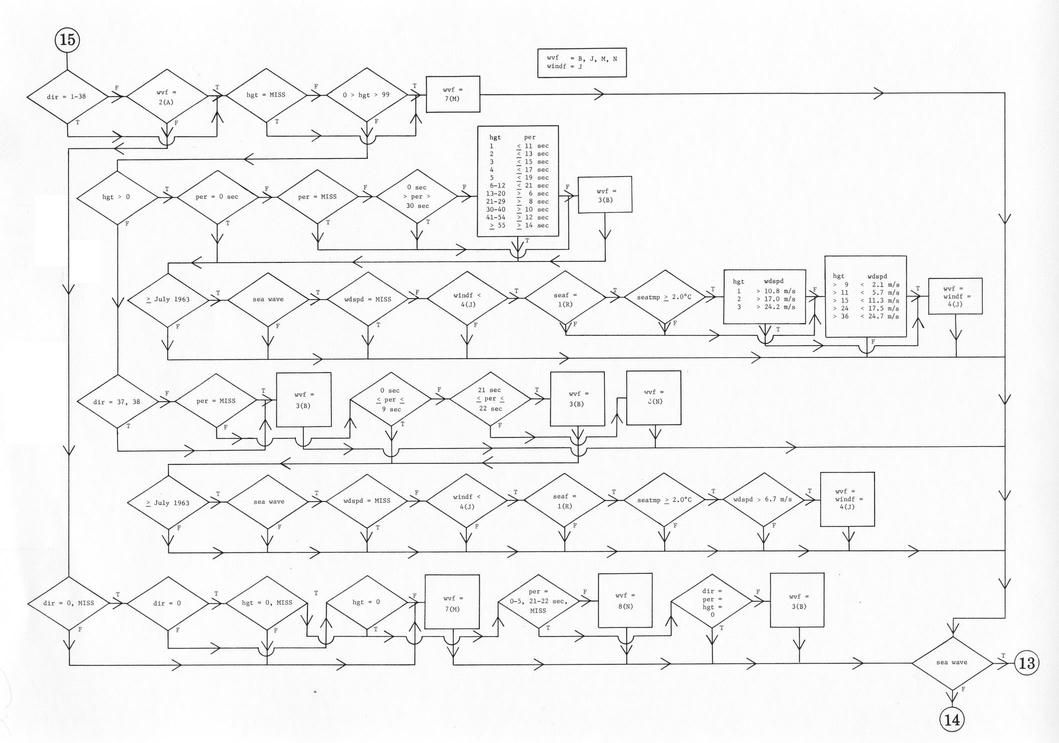
2. Quality Control Flowchart
The following flowchart (covering 14 pages) outlines
all the QC checks and conditions for flag assignment. The flags are assigned a
value from Table J0-2.
The different elements used to determine the flag values are
abbreviated as follows:
y         -    latitude
wddir     -    wind direction
wdspd     -    wind speed
vis       -    visibility
preswx    -    present weather
pastwx    -    past weather
press     -    sea level pressure
dryblb    -    air temperature
wetblb    -    wet bulb temperature
dewpt     -    dew point temperature
seatmp    -    sea surface temperature
N         -    total cloud amount
Nh        -    lower cloud amount
CL        -    low cloud type
h         -    cloud height
CM        -    middle cloud type
CH        -    high cloud type
wvdir     -    wave direction*
wvper     -    wave period
wvhgt     -    wave height
swldir    -    swell direction
swlper    -    swell period
swlhgt    -    swell height
a         -    barometric tendency
ppp       -    amount of pressure change
The order of these variables corresponds to that given in
supp. F,
which also contains a section describing the possible flag values and
details on the representation of the flags in LMR. Barometric tendency
and amount of pressure change are available only in the supplemental
attachment for data converted into LMR from formats TD-1100 (when the
additional data indicator is 6), TD-1127, and TD-1129.
Note: The units of wave and swell heights as listed on the flowchart
are "height in 1/2 meter increments" (ref. note under WP in supp. F),
which was undocumented in the original published edition of COADS Release 1.
The wave or swell variables or flags are occasionally abbreviated
generically,as follows:
dir  -    wave or swell direction
per  -    wave or swell period
hgt  -    wave or swell height
wvf  -    wave or swell flag
The process so abbreviated is applied identically to both waves and
swells.
The following are additional abbreviations:
MISS -    missing value
n    -    number of observations in  and σ
   -    mean
σ    -    standard deviation
MISS is a legitimate value for any variable to indicate that it was
missing. The mean and standard deviation are 5° latitude x 5°
longitude long-term monthly values for selected variables, which were
obtained together with the 1° Marsden Square (MSQ) landlocked table from
NCDC. These were used to check for extreme values -- but only when the
associated number of observations was 25 or more. Therefore, these
checks were not made in regions of sparse data, such as high
latitudes.
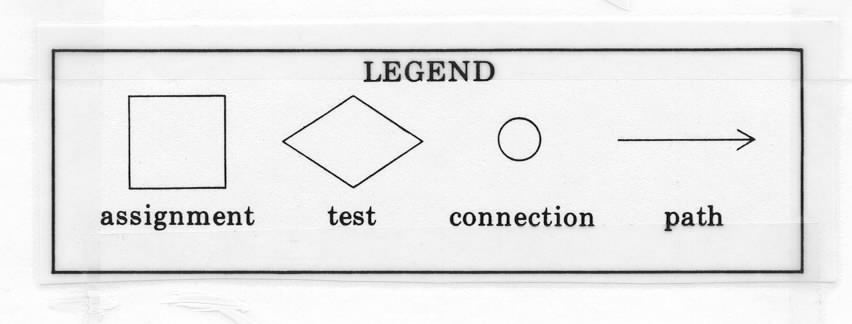
Four symbols make up the flowchart:
- A rectangle denotes flag assignment in the form "flag =
n(a)," where flag is abbreviated as given in Table
J0-1, n is the coded value, and a is its
corresponding character value.
- A diamond (or in a few cases, a large rectangle) denotes a
test involving the element, where the path marked "T" is
followed if the condition stated is true, and the path
marked "F" is followed if the condition stated is false.
- A circle denotes flow connections, which connect together
the different pages. The flowchart starts at the connection
labeled "1" and ends at the connection labeled "end" (on
the second to last page).
- Lines with arrows show the path of logical flow (a half-circle on a
line bridges the intersection with another line).
In addition, the various flag assignments covered by a particular page
are given at the top of that page.
___________________
* In their conversion of data into TD-11, NCDC usually substituted
wind direction into missing (wind) wave direction since 1 January
1968, when wave direction was no longer ordinarily reported. Instead
of continuing this practice, a temporary substitution of wind
direction into missing wave direction was made during QC of the wave
fields. Afterwards, the wave direction was left missing, thereby
preserving any remaining information regarding whether it was
separately reported. Note: this same procedure was followed for buoys,
although they measure only height and period without discriminating
between wave and swell (NCDC placed this information in wave fields).
___________________
Flowcharts (originally pp. J6-J19)


MAIN | supp. A |
supp. B | supp. C |
supp. D | supp. E |
supp. F | supp. G |
supp. H | supp. I |
supp. J | supp. K